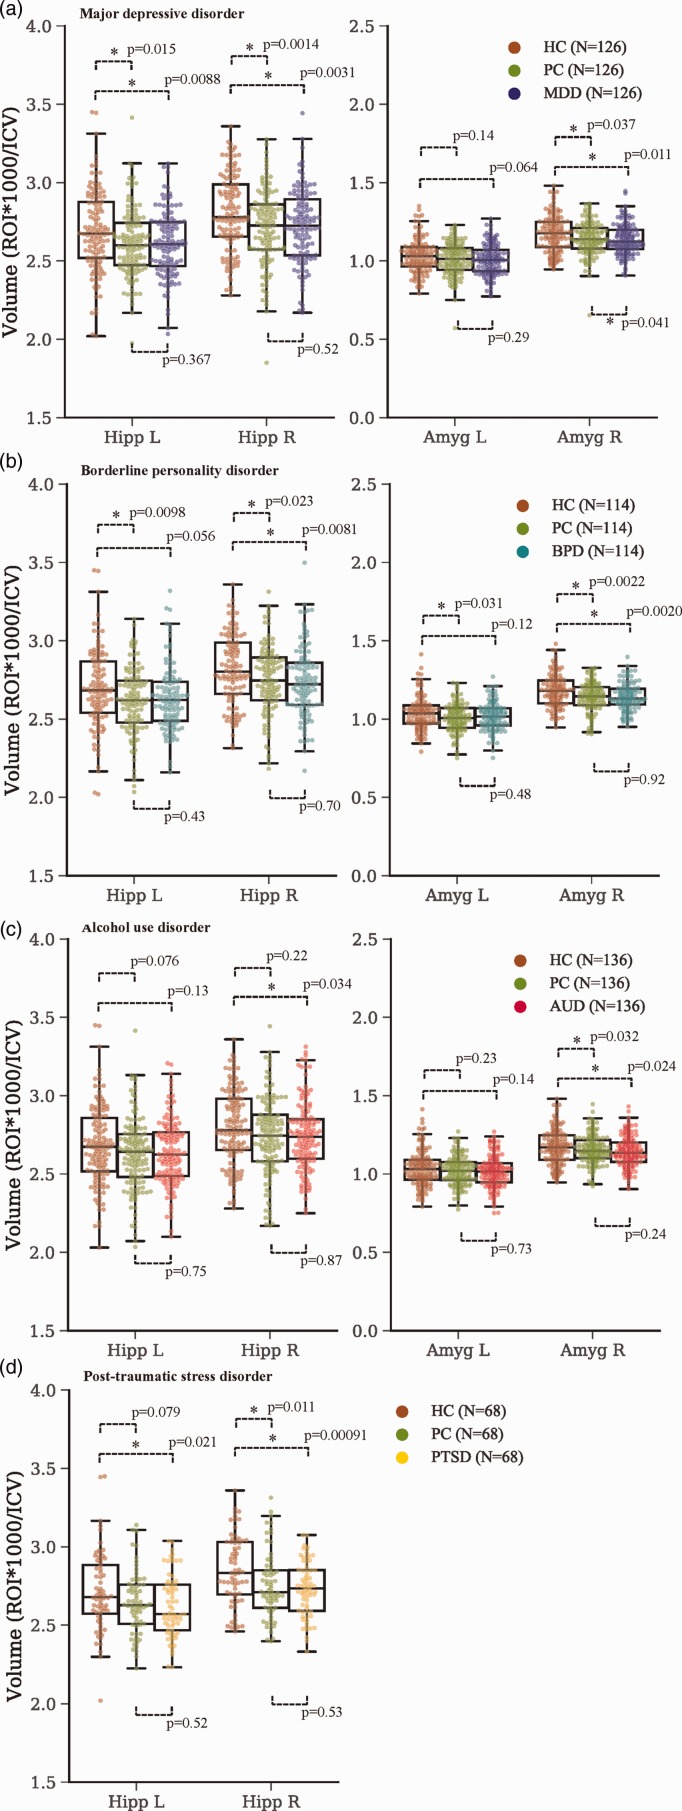
Figure 2.
Hippocampal and amygdalar volumes for all groups. (a) Major depressive disorder; (b) Borderline personality disorder; (c) Alcohol use disorder and (d) Post-traumatic stress disorder. Boxplots show median value as horizontal line within boxes, the top line of the boxes is the upper quartile (75% of the data lies below this line), the bottom line of the boxes is the lower quartile (25% of the data lies below this line), whiskers represent the rest of the range of the data that is outside the interquartile. Points that are outside the whiskers are considered outliers. All data points are shown jittered within the boxplots. *p < 0.05. Amyg: amygdala; AUD; alcohol use disorder; BPD: borderline personality disorder; HC: healthy control; Hipp: hippocampus; ICV: total intracranial volume; L: left; MDD: major depressive disorder; PC: psychiatric control; PTSD: posttraumatic stress disorder; R: right; ROI: region of interest.

