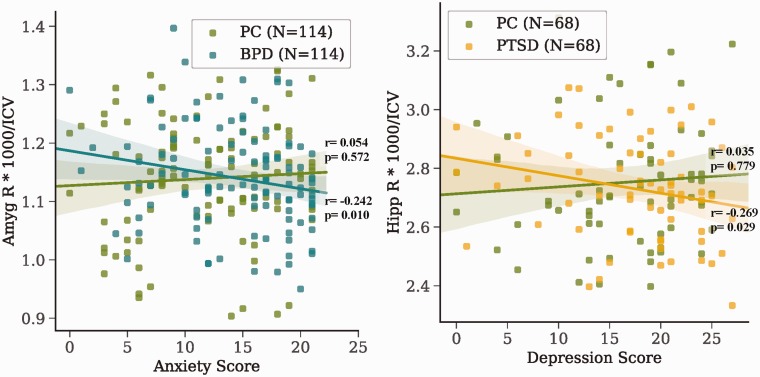
Figure 3.
Correlations between psychiatric traits and volumes within each patient group. Pearson correlation r and p values are shown for each line of best fit (p < 0.05, no multiple corrections). Volumes were divided by ICV and scaled by 1000. Amyg: amygdala; BPD: borderline personality disorder; Hipp: hippocampus; ICV: total intracranial volume; PC: psychiatric control; PTSD: posttraumatic stress disorder; R: right.

