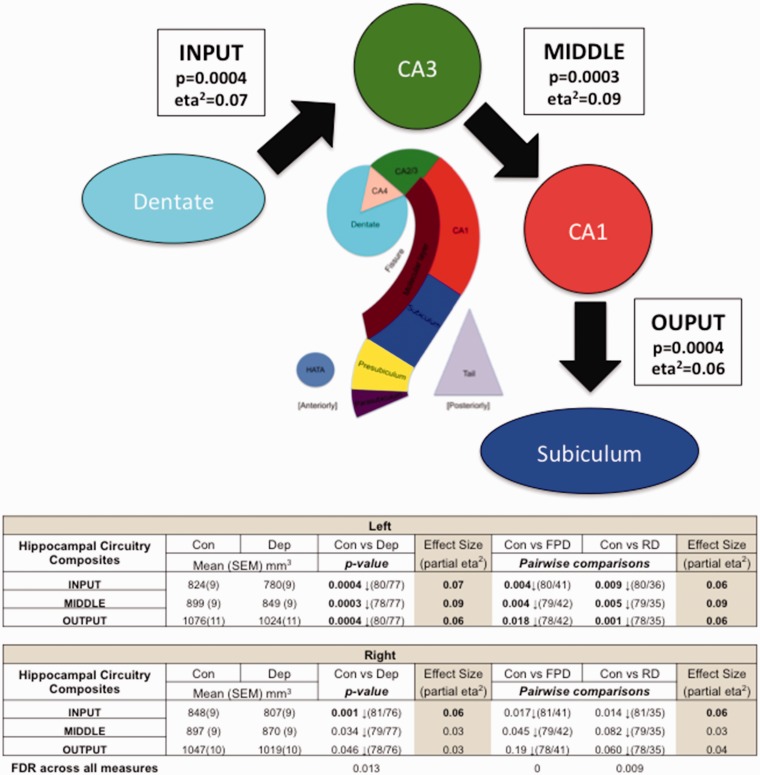
Figure 1.
Information flow through the hippocampus and changes in depression. The arrows show a highly simplified account of the information flow through the hippocampus. Using computed Freesurfer 6.0 substructures, we created Input, Middle and Output composites representative of the three stages of information flow through the hippocampus. The table represents differences between controls and total depressed, controls and first presentation and controls and recurrent depressed groups. p-values denote significance between groups. Partial eta2 describes effect size (0.01 = low, 0.06 = moderate and 0.14 = large). Bold text indicates p-values that survived FDR correction or moderate to large effect size. Volumetric reductions were found across all three circuit components in depression in the left side compared to controls. CA, cornu ammonis; Con, controls; Dep, total depressed; FPD, first presentation depression; FDR, false discovery rate; RD, recurrent depression.

