Image 1.

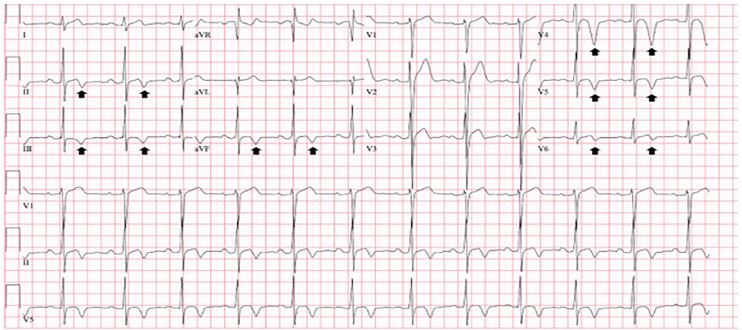
Initial electrocardiogram on presentation revealing deep and symmetric T-wave inversions in the inferior leads (II, III, aVF) and precordial leads V4–V6 (arrows).

Initial electrocardiogram on presentation revealing deep and symmetric T-wave inversions in the inferior leads (II, III, aVF) and precordial leads V4–V6 (arrows).