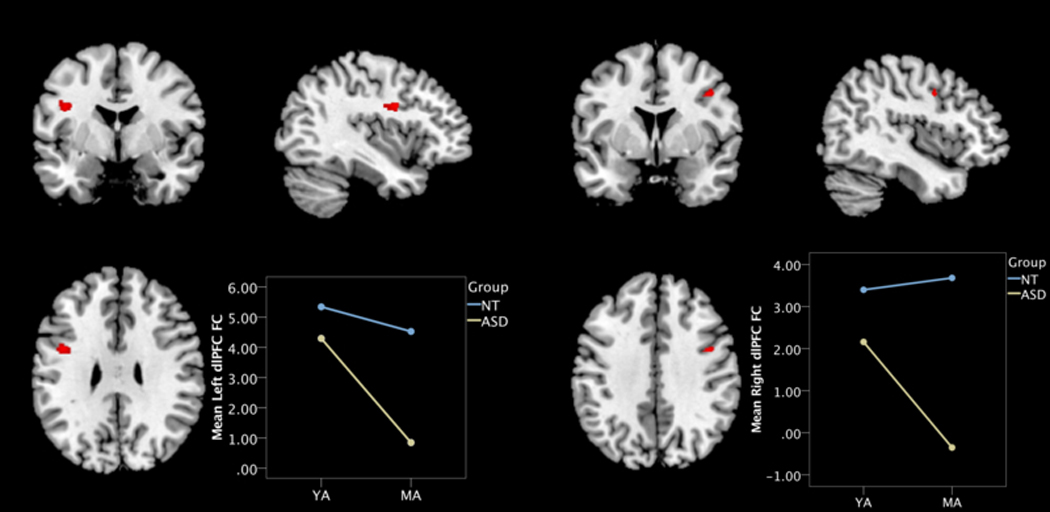
Figure 3.

EN connectivity regions of age group by diagnosis group “exacerbated aging” interaction contrast in (a) left and (b) right hemispheres. Insets depict mean FC values from cluster peak to the rest of the EN for each group: Neurotypical (NT; blue); autism spectrum disorder (ASD; yellow); Middle-Age (MA); Young-Adult (YA); dorsolateral prefrontal cortex (dlPFC)
