
Figure 4. Analysis of cement remodeling by μCT.
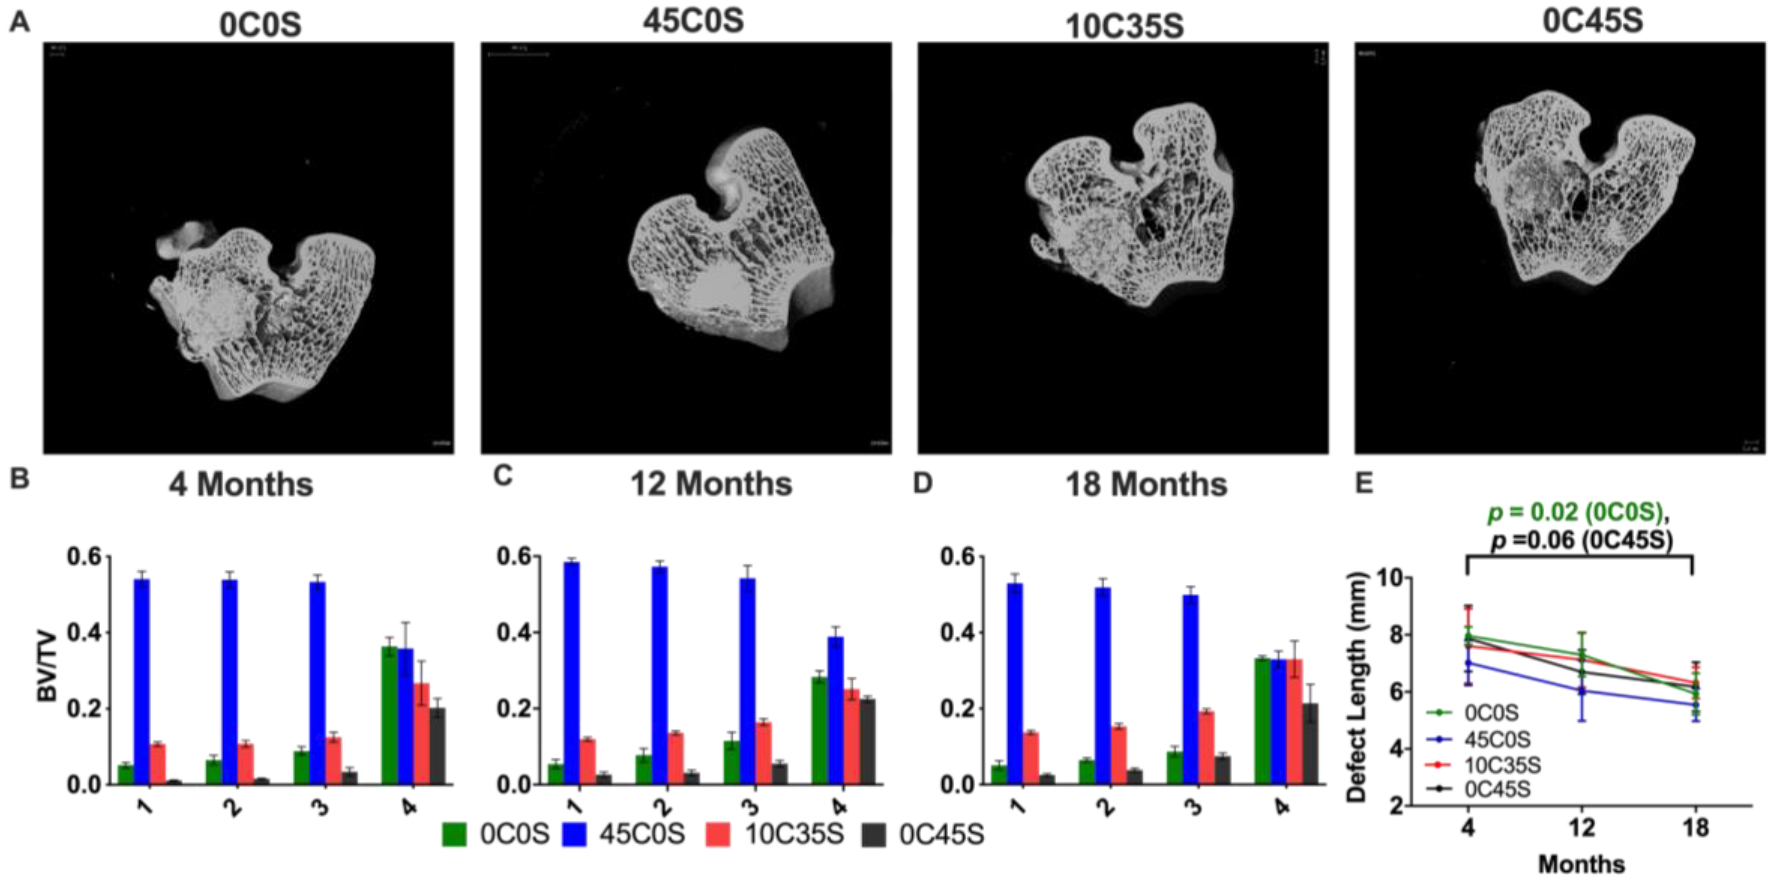
(A) Representative 2D μCT images (transverse plane) at 18 months. (B-D) BV/TV calculated from μCT reconstructions in each ROI and material at (B) 4, (C) 12,and (D) 18 months. (E) Defect length measured from 2D μCT reconstructions at 4, 12, and 18 months.