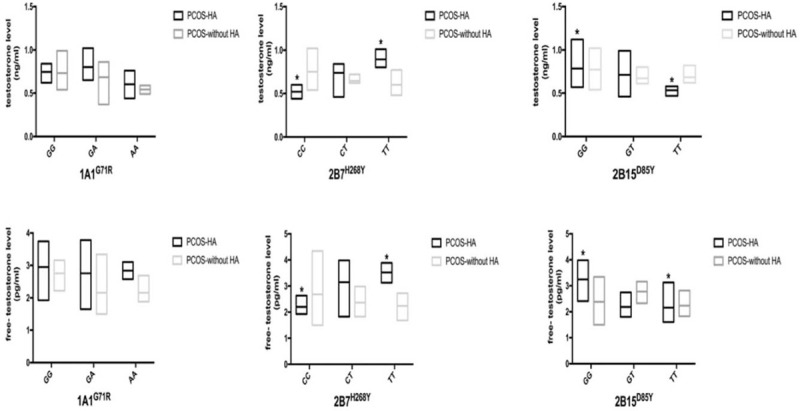
Figure 2.

The association between glucuronosyltransferase (UGT) single nucleotide polymorphisms (SNPs) and T, FT levels. Testosterone (T), free testosterone (FT). Data are represented as M ± SD, ∗P < .05. HA = hyperandrogenemia, PCOS = polycystic ovary syndrome.
