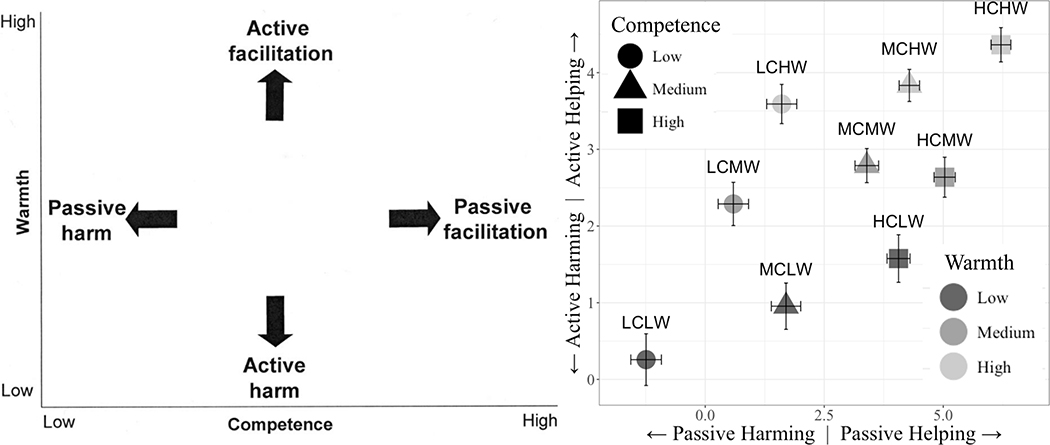
Figure 1.
Left panel: the BIAS map model (adapted from Cuddy et al., 2007); Right panel: participants’ actual active and passive intention data (helping minus harm). C = Competence; W = Warmth; H = High; M = Medium; L = Low. Color indicates degree of warmth; shape indicates degree of competence. Error bars indicate standard error of the mean differences.

