Figure 4.

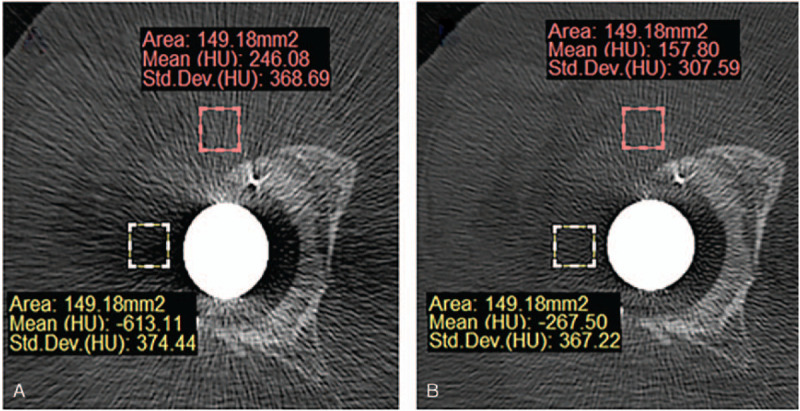
Procedure of 2D measurement of average CT value ROI. Red rectangle was ROIa which focused on B-H metal artifact. Yellow rectangle was ROIb which focused on P-S metal artifact. (A) Non-O-Mar image and (B) O-Mar image.

Procedure of 2D measurement of average CT value ROI. Red rectangle was ROIa which focused on B-H metal artifact. Yellow rectangle was ROIb which focused on P-S metal artifact. (A) Non-O-Mar image and (B) O-Mar image.