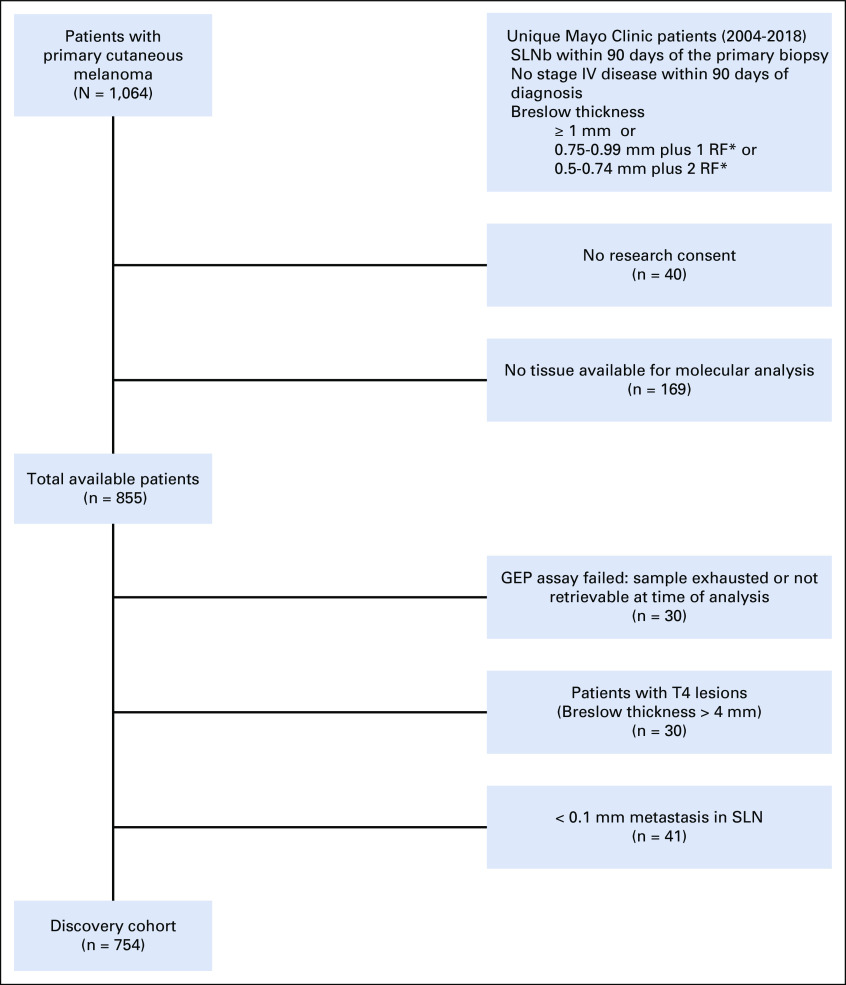
FIG A1.
Study flow diagram. The figure depicts the enrollment of patients, inclusion and exclusion criteria, and other potential sources of retrospective bias such as the absence of research consent, the unavailability of tissue for molecular analysis, or failed gene expression profiling (GEP). (*) Risk factors were age < 40 years, mitotic rate > 0/mm2, and tumor ulceration present. SLN, sentinel lymph node; SLNb, sentinel lymph node biopsy.

