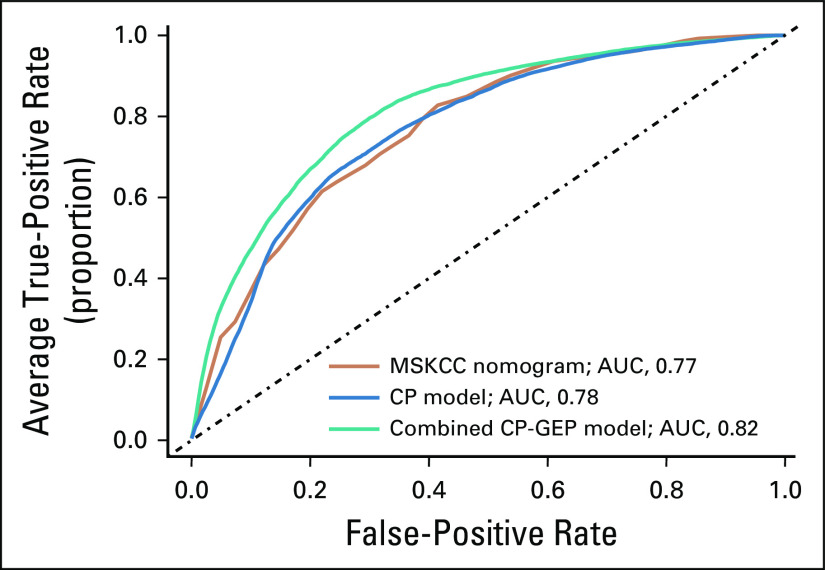
FIG A5.
Memorial Sloan Kettering Cancer Center (MSKCC) nomogram performance versus a combined clinicopathologic (CP) and gene expression profile (GEP). Orange line, model based on MSKCC nomogram; blue line, model based on CP variables (CP model); teal line, model based on gene expression and CP variables combined (CP-GEP model). For each receiver operating characteristic curve the average area under the curve (AUC) is reported. Curves are averages over 100 repeats obtained by concatenating the threefold cross-validation test results.

