
Figure 1.
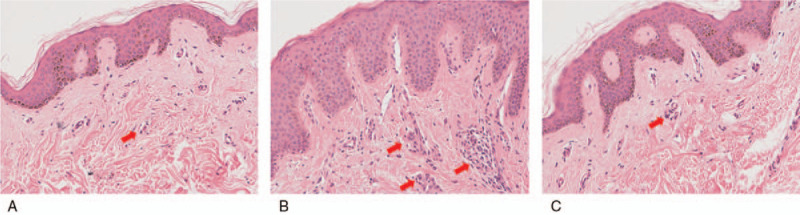
The results of epidermal and dermal H&E staining. The number of infiltrated cells (red arrow) was much lower in the A group and the C group than in the B group (images: 200×). A group = keloid samples from keloid patients treated with HBO therapy, B group = keloid samples from keloid patients treated without HBO therapy, C group = normal skin samples from patients without obvious scarring, H&E = hematoxylin and eosin.