Figure 1.

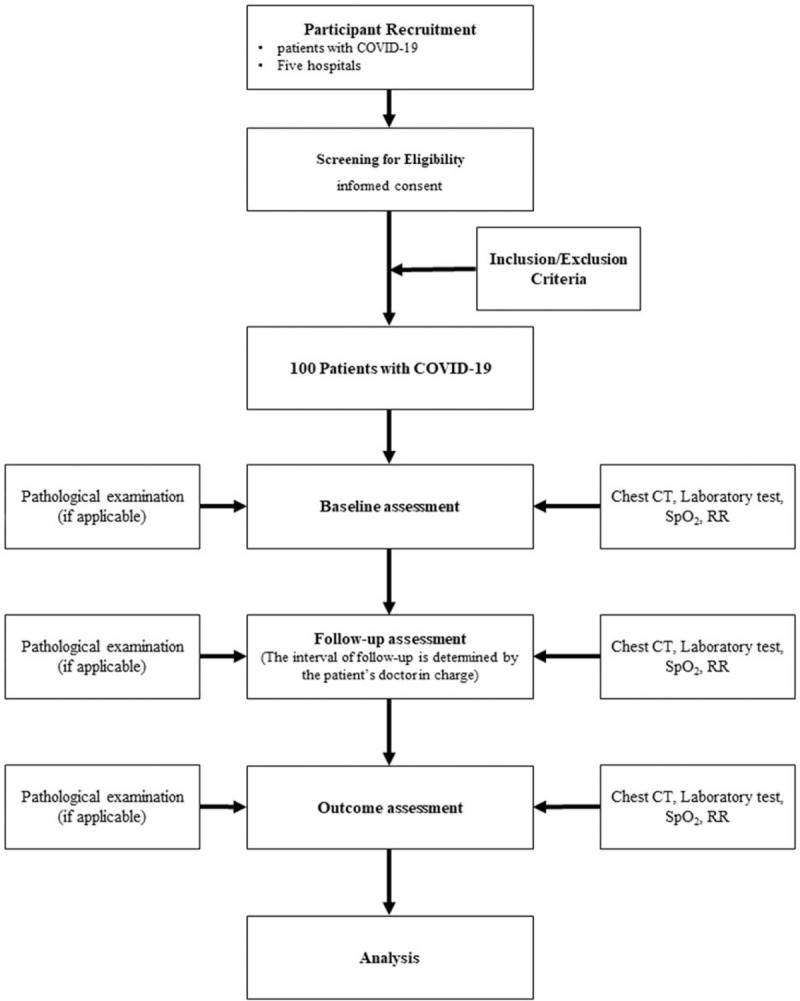
A flowchart of the study. COVID-19 = disease coronavirus disease 2019, CT = computer tomography, RR = respiratory rate, SpO2 = percutaneous oxygen saturation.

A flowchart of the study. COVID-19 = disease coronavirus disease 2019, CT = computer tomography, RR = respiratory rate, SpO2 = percutaneous oxygen saturation.