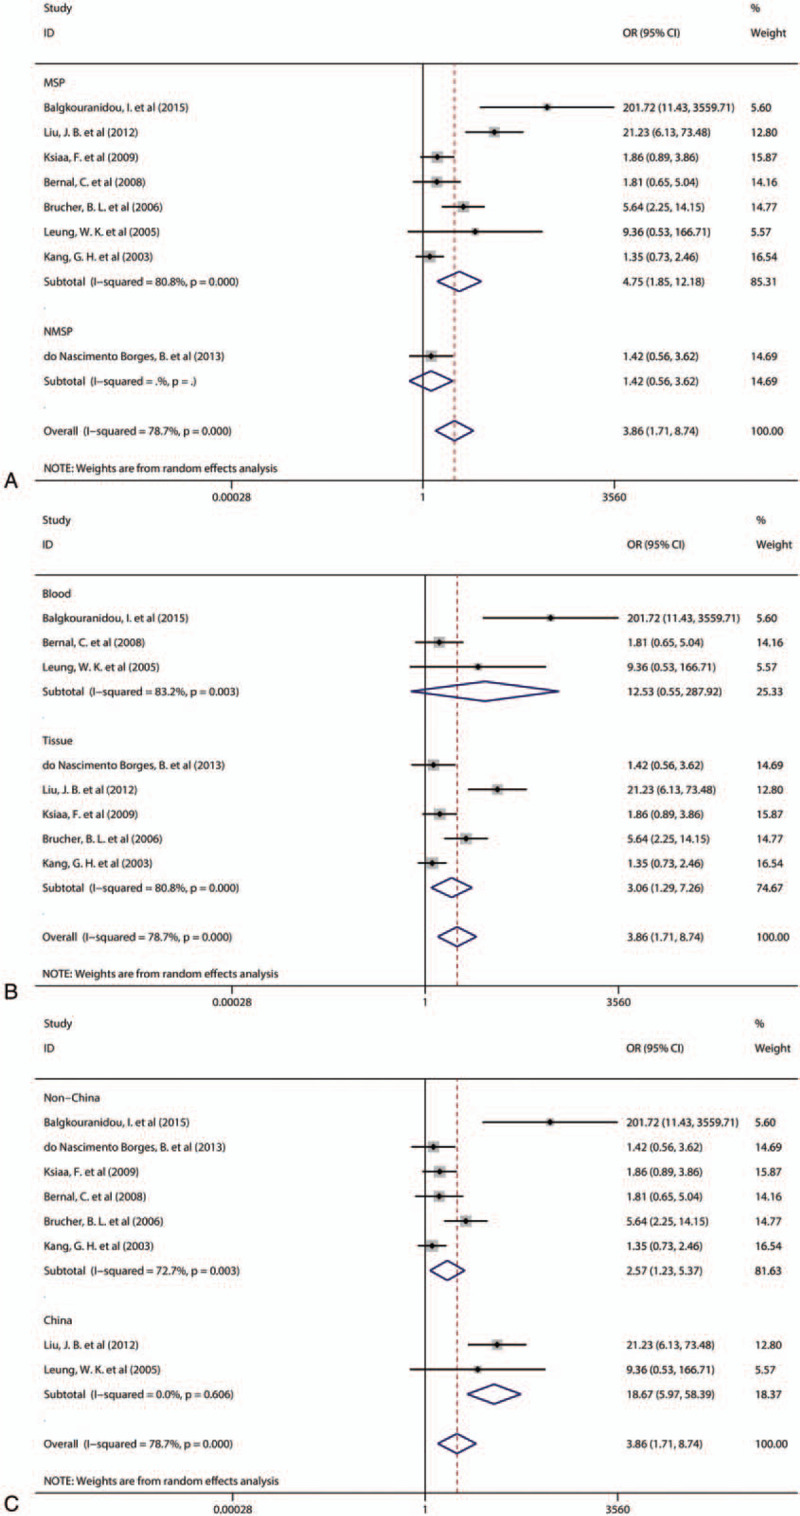
Figure 3.

A: Forest plots of the subgroup analysis according to methylation detection methods. B: Forest plots of the subgroup analysis according to sample type. C: Forest plots of the subgroup analysis according to country. OR = odds ratio, CI = confidence interval.
