
Fig. 2. Generation of transgenic mosquitoes targeting the sporozoite-stage malaria parasite in the hemolymph with single-chain antibodies fused to antiparasitic effectors and P. falciparum infection phenotypes at both the oocyst and sporozoite stages.
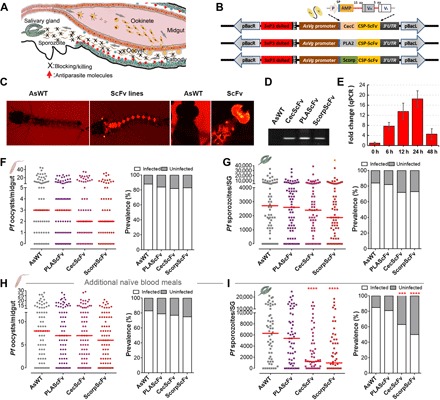
(A) Schematic illustration of transgenic targeting of parasite sporozoite infection stages and the design of AsVg-driven transgenes to be expressed in the fatbody after the blood meal, to specifically target the parasites at this stage. (B) Schematic representation of single-chain antibody (ScFv) targeting the CSP protein fused to AMP. The single-chain antibodies consist of variable regions of the VH heavy and VL light chains. Each transgene encodes a short 5–amino acid polypeptide linker between VH and VL and a long 15–amino acid (aa) sequence linking the VH to the AMP peptides (CecC, PLA2, and Scorpine), including the CecA signal peptide sequence (SP). Three individual transformation plasmids, pBAC-AsVg-CecC (or PLA2, Scorpine)–ScFv (with the red fluorescent eye reporter gene 3xP3 dsRed), were used for the germline transformation. AsVg promoter with the same AsVg endogenous terminator (AsVg 3′-UTR) was used. (C) Fluorescent images of a positive larva and an adult transgenic ScorpScFv mosquito. (D) PCR validation of the partial transgene cassette (~500 bp) of CecScFv, PLAScFv, and ScorpScFv in the transgenic mosquitoes. (E) Transcript abundance of the transgene in the fatbody of ScorpScFv transgenic line at various time points PBM. Each bar represents the relative fold change in the transgene as compared to the control at time 0 hour. The S7 ribosomal gene was used to normalize the cDNA templates. Error bars indicate SEM. (F to I) P. falciparum (NF54) oocyst and sporozoite infection intensities and prevalence of the three transgenic ScFv lines (PLAScFv, CecScFv, and ScorpScFv) at 8 dpi in the gut or 14 dpi in the salivary glands (SG) without (F and G) or with (H and I) additional naïve blood meals at days 5 and 9 post-infectious blood meal (PIBM). Each dot represents the number of parasites in an individual midgut or salivary glands, and the horizontal lines (red) indicate the median values. Detailed statistical analysis is presented in table S2.