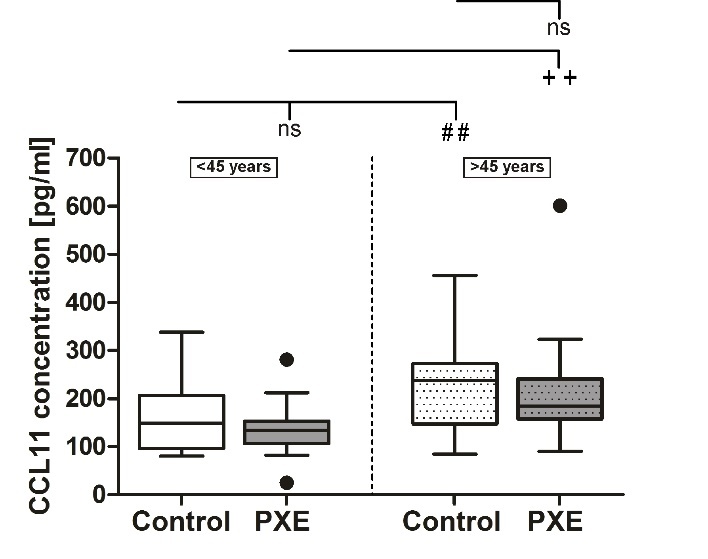
Figure 1.

CCL11 protein concentration in sera from PXE patients (grey) and healthy controls (white). Data are shown as Box-Plot with median, 25th and 75th percentile and Tukey whiskers (± 1.5 times interquartile range). Control vs. PXE: ns p>0.05. Cohorts <45 years (n=23) vs. cohorts >45 years (n=22): ##/++ p≤0.01.
