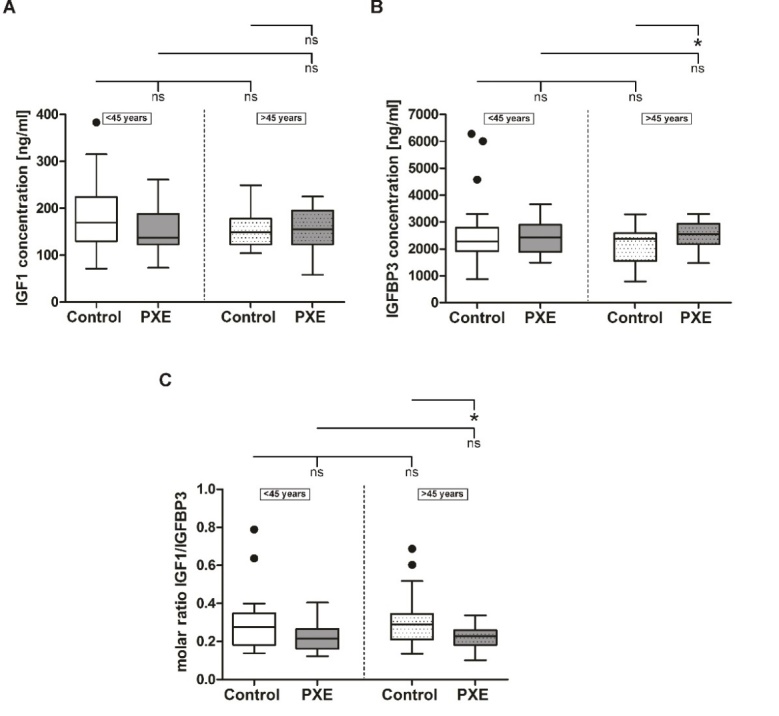
Figure 3.

Systemic IGF1 and IGFBP3 protein concentration in sera from PXE patients (grey) and healthy controls (white). (A) IGF1 serum protein concentrations of PXE patients (grey) and healthy controls (white) (B) IGFBP3 serum protein concentrations of PXE patients (grey) and healthy controls (white) (C) molar IGF1/IGFBP3 ratio of serum protein concentrations of PXE patients (grey) and healthy controls (white). Data are shown as Box-Plot with median, 25th and 75th percentile and Tukey whiskers (± 1.5 times interquartile range). Control vs. PXE: * p≤0.05; ns p>0.05. Cohorts <45 years (n=23) vs. cohorts >45 years (n=22): ns p>0.05.
