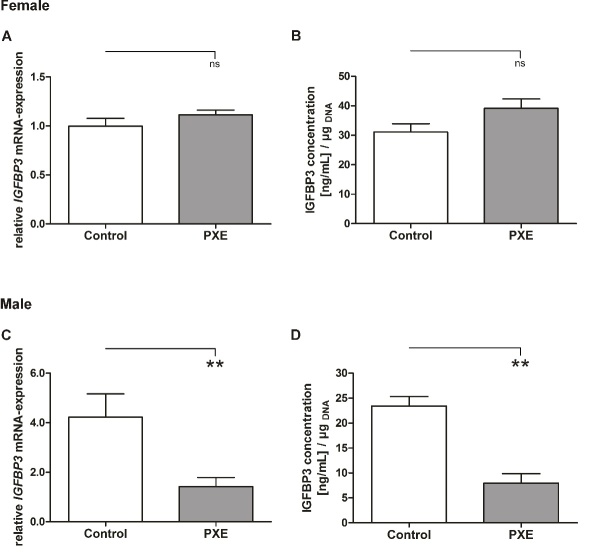
Figure 5.
Male and female specific IGFBP3 mRNA expression and protein concentration. (A) Relative IGFBP3 mRNA expression of female PXE fibroblasts (grey) and NHDF (white). (B) IGFBP3 protein concentration in supernatant of female PXE fibroblasts (grey) and NHDF (white). (C) Relative IGFBP3 mRNA expression of male PXE fibroblasts (grey) and NHDF (white). (D) IGFBP3 protein concentration in supernatant of male PXE fibroblasts (grey) and NHDF (white). Data are shown as mean ± SEM. Control vs. PXE: ** p≤0.01; ns p>0.05.

