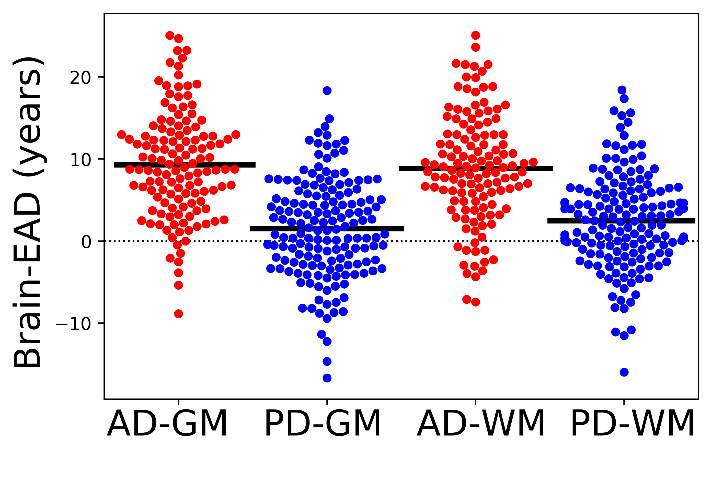
Figure 3.

Comparison of Brain-EAD values between PD patients (blue spot) and AD patients (red spot) for the GM and WM models. The mean brain-EAD values of each group is illustrated with a solid black line. The reference line is illustrated with a dashed black line (y = 0).
