Figure 4.

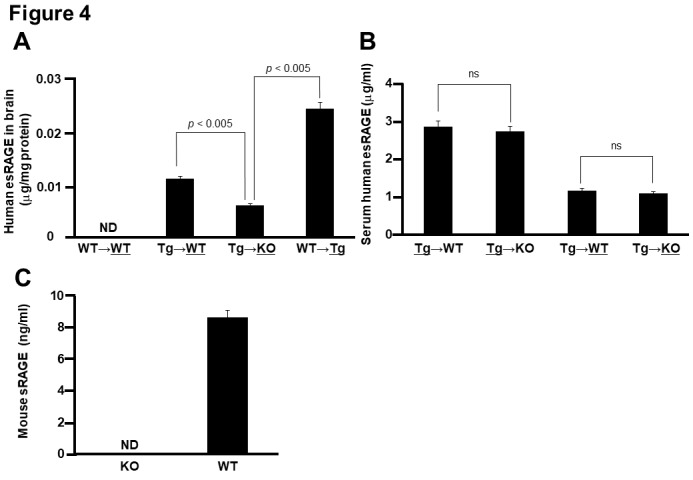
Quantitative detection of human esRAGE A) Human esRAGE contents in the brain parenchyma of WT side of WT→WT pair, WT side of Tg→WT pair, KO side of Tg→KO pair, and Tg side of WT→Tg pair (n = 3). B) Serum human esRAGE concentrations in Tg side of Tg→WT pair, Tg side of Tg→KO pair, WT side of Tg→WT pair, and KO side of Tg→KO pair (n = 3). C, Serum mouse sRAGE concentrations in KO and WT mice (n = 3). ND, not detected; ns, not significant. Values are mean ± SEM.
