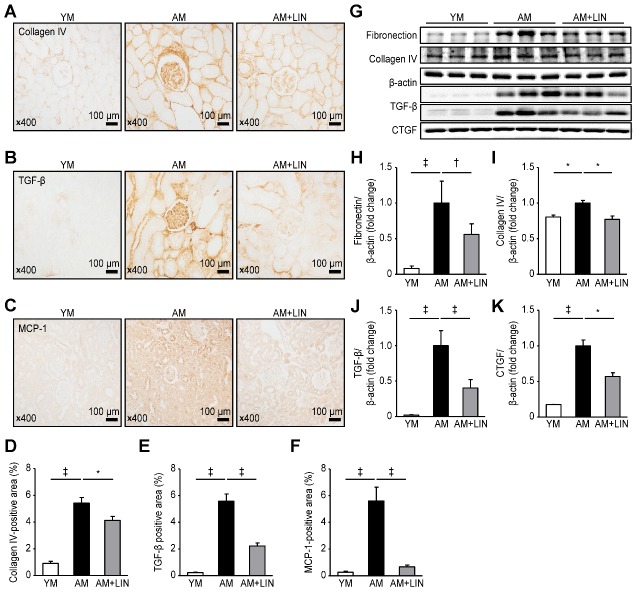
Figure 2.
Effects of linagliptin on fibrosis and inflammation in renal tissue. (A) The numbers of collagen IV-, (B) TGF-β- and (C) MCP-1-positive cells were decreased in the AM + LIN group compared to the AM group. (D), (E) and (F) The areas positive for collagen IV, TGF-β and MCP-1 were markedly increased in the AM + LIN group. (G) Levels of markers fibrosis and inflammation were analyzed using western blotting. (H) and (I) Comparison of fibronectin and collagen IV levels between the three groups. (J) and (K) Comparison of TGF-β and CTGF levels between the three groups. (*p < 0.05, †p < 0.01, and ‡p < 0.001).

