Figure 5.
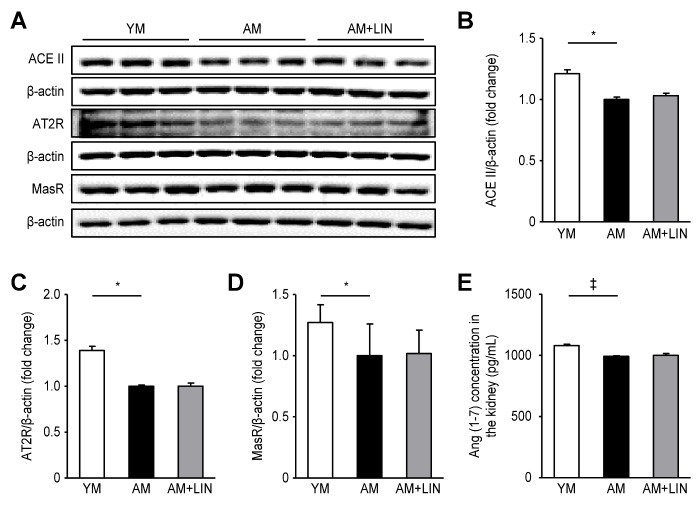
Effects of linagliptin on angiotensin (1-7) concentrations and ACEII, AT2R and MasR protein expression in kidneys. (A) Representative western blots of ACEII, AT2R and MasR protein expression. (B), (C) and (D) Levels of the ACEII, AT2R and MasR proteins were decreased in the AM group compared to the YM group (p < 0.05 for all), but the levels were similar in the AM and AM + LIN groups. (E) Lower levels of Ang (1-7) were detected in the kidneys from the AM group than in the YM group (p < 0.001), but similar levels were observed in the AM and AM+LIN groups. (*p < 0.05 and ‡p < 0.001).

