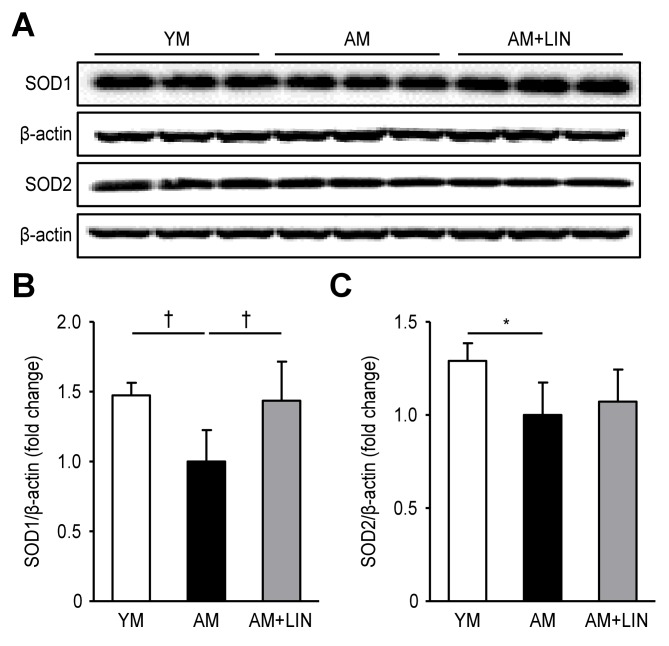
Figure 7.
Effects of linagliptin on SOD1 and SOD2 in renal tissue. (A) Representative western blots of SOD1 and SOD2 levels. (B) SOD1 levels were increased in the AM + LIN group compared with the AM group (p < 0.01). (C) SOD2 levels were decreased in the AM group compared to the YM group (p < 0.05), but the levels were not significantly different between the AM group and the AM + LIN group. (*p < 0.05 and †p < 0.01).

