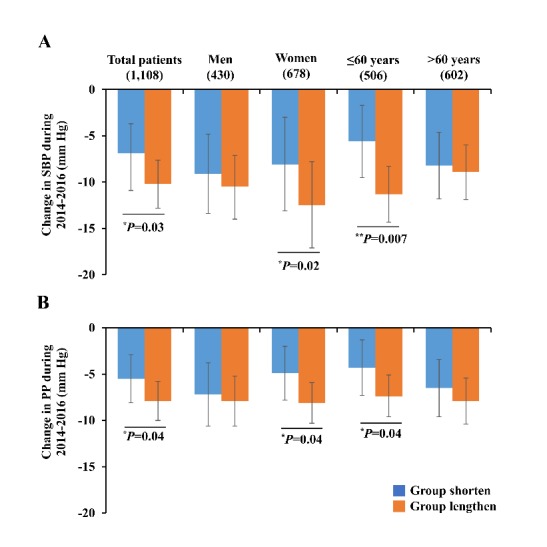
Fig 2.

Differences of blood pressure lowering between the lengthen and the shorten groups during 2014-2016. Abbreviations: SBP, systolic blood pressure; PP, pulse pressure. *P<0.05, **P<0.01. P values and adjusted mean were calculated by generalized linear model adjustment for covariates including age, gender (except in gender-stratified analysis), smoking status, alcohol intake, medical history, the stage of baseline blood pressures, baseline telomere length, and changes in BMI, waist-to-hip, fasting glucose, TC, triglycerides, HDL-C, and LDL-C from 2014 to 2016. Error bars indicate 95%CI.
