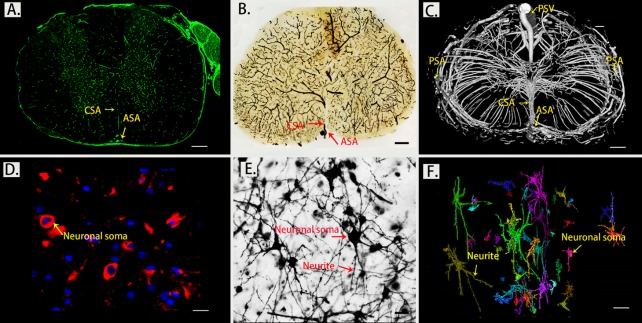
Figure 1.
Morphology of the spinal cord microvasculature and neuronal network detected by a histological technique and SRμCT. (A) Immunofluorescence staining of transverse sections with CD31, scale bar = 250 μm; (B) Thick sections detected with light microscopy for vessel visualization, scale bar = 250 μm; (C) 3D SRμCT images of thoracic spinal cord microvasculature, scale bar = 250 μm; (D) Immunofluorescence staining of transverse sections with NeuN, scale bar = 20 μm; (E) Golgi stained neurons in transverse sections of the spinal cord examined by light microscopy, scale bar=20 μm; (F) Pseudocolored images of 3D structures of the intrinsic neuronal network of the spinal cord visualized with SRμCT, scale bar = 20 μm. (PSV?=?posterior spinal vein; PSA= posterior spinal artery; ASA?=?anterior spinal artery; CSA?=?central sulcal artery)

