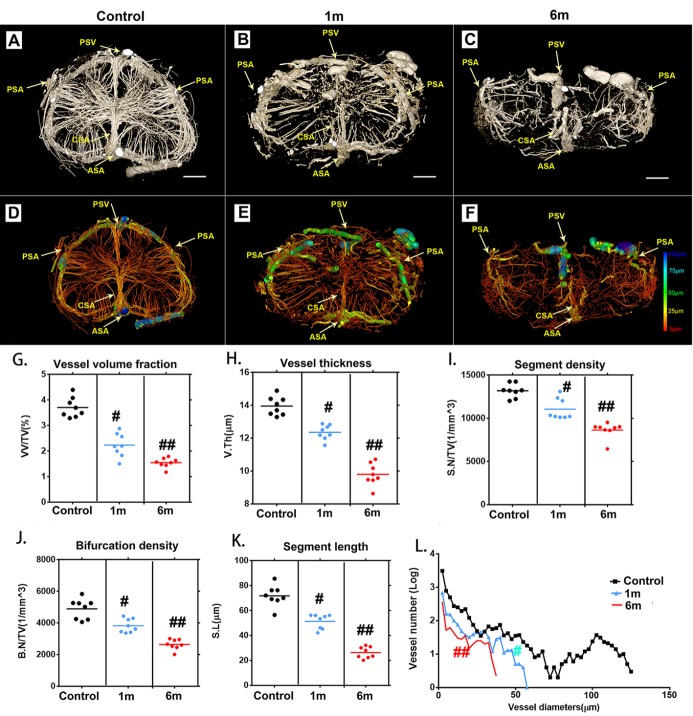
Figure 3.
Characteristic 3D morphological alterations of the thoracic spinal cord microvasculature at different time points after surgery to induce chronic compression. (A-C) Representative 3D cross-sectional images of the spinal cord microvasculature after 1 and 6 months of chronic compression. (D-F) Pseudocolored image of the spinal cord microvasculature correlated with vessel thickness at the corresponding time point after compression surgery. (G-K) Quantification of morphological alterations in normal samples and after chronic thoracic spinal cord compression at different time points using network analysis. The vessel volume fraction (G), vessel thickness (H), segment density (I), bifurcation density (J) and segmental length (K) of the thoracic spinal cord significantly decreased after 1 month of chronic compression and worsened after 6 months, at the final follow-up. (L) Changes in the frequency distribution of vascular diameters in the normal and chronic compression groups after 1 and 6 months of compression. The pseudocolor bar in panel F indicates how vascular thickness was coded with different colors. (PSV?=?posterior spinal vein; PSA= posterior spinal artery; ASA?=?anterior spinal artery; CSA?=?central sulcal artery) Scale bar = 250 μm. One-way analysis of variance followed by the Dunn post hoc test was performed. #p?<?0.05, significant difference between the control group and 1 month postcompression. ##p?<?0.01, significant difference between the control group and 6 months postcompression.

