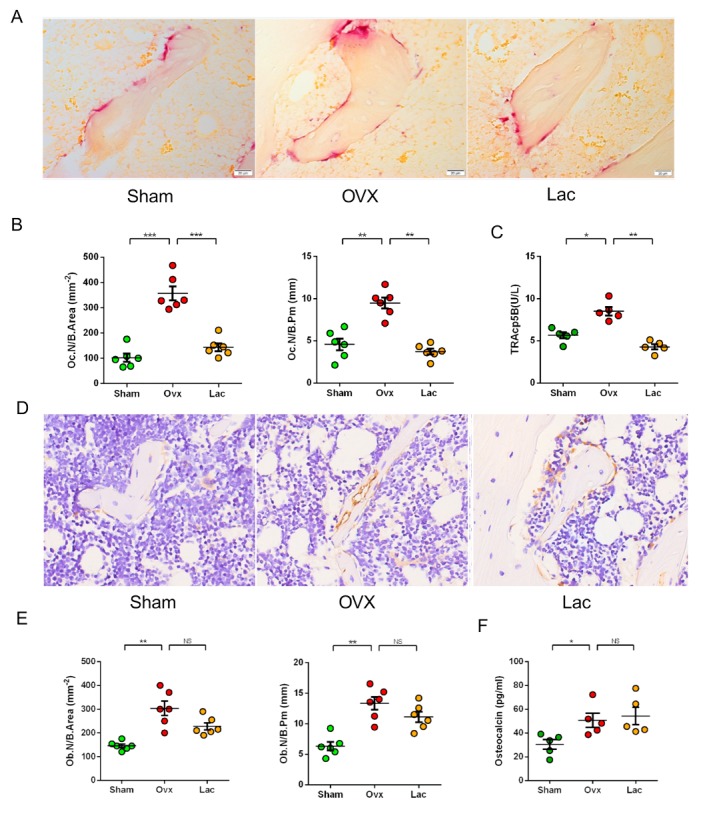
Figure 2.

Lactulose suppressed osteoclastogenesis. (A) Tartrate-resistant acid phosphatase-stained sections of the distal femur. Scale bar: 20 μm. (B) Oc.N / B.Area. and Oc.N / B.pm. (C) Serum levels of TRAcp-5b. (D) Osteocalcin stained sections of the distal femur. Original magnification ×40. Scale bar: 20 μm. (E) Ob.N / B.Area. and Ob.N / B.pm. (F) Serum levels of osteocalcin. n= 5 mice per group in all panels. Data are expressed as mean ± SEM. *P < 0.05, **P < 0.01, and ***P < 0.001 compared with the corresponding group.
