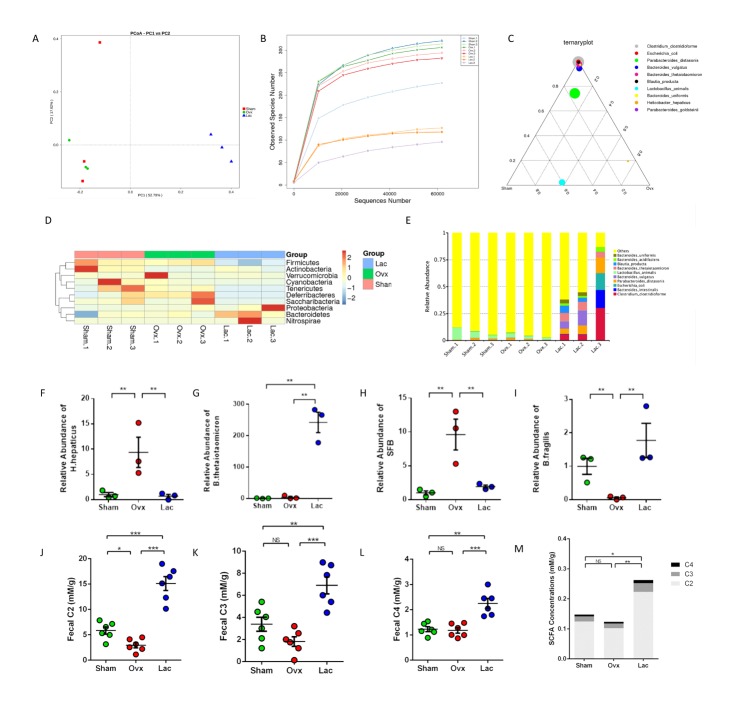
Figure 5.
Lactulose altered gut microbiota and increased SCFA production. (A) PCoA analysis. (B) Observed Species Number in different sequence number. (C) Ternary plot of different groups. (D) Taxonomy distribution at the genus level in different samples. (E) Top 10 enriched species in all groups. (F-I) Significantly differed species in the different groups; (J-L) The fecal SCFA levels of each group. (M) The serum SCFA levels of each group. Data are expressed as mean ± SEM. *P < 0.05, **P < 0.01, and ***P < 0.001 compared with the corresponding group.

