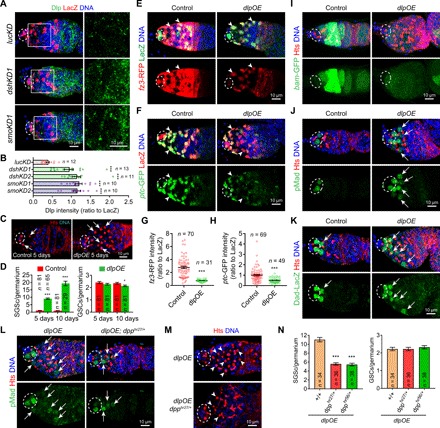
Fig. 2. Dlp overexpression sufficiently inhibits Hh and Wnt signaling and promotes BMP signaling.

The germaria (A, E, and F) are labeled for PZ1444-LacZ to visualize IGS cells (two by arrowhead) and cap cells (broken ovals), while DAPI staining identifies all nuclei. (A) Merged confocal images of germaria showing that Dlp protein (green) levels are significantly up-regulated in the dshKD1 and smoKD1 IGS cells 2 days after knockdown (B) quantification results normalized to LacZ; n = germarial number. (C) dlp overexpression (dlpOE) in IGS cells causes the accumulation of significantly more spectrosome-containing undifferentiated SGCs (only two in control and four in dlpOE indicated by arrows) in 5- and 10-day-old germaria but have no or a little impact on GSCs (highlighted by broken ovals) (D) CB/SGC and GSC quantification results; n = germarial number. (E to H) ptc-GFP and fz3-RFP expression is drastically down-regulated in dlpOE IGS cells (arrowheads) 2 days after overexpression compared with the control (G and H: quantification results on fz3-RFP or ptc-GFP intensities normalized to LacZ in each IGS cell; n = germarial number). (I to K) Merged confocal images showing that dlpOE germaria accumulate more bam-GFP–negative, pMad-positive, and Dad-LacZ–positive SGCs (some by arrows in J and K). (L to N) Inactivating one copy of dpp by dpphr27/+ or dpphr56 significantly decreases both pMad-positive SGCs (L) and GSC accumulation (M) caused by dlpOE without any obvious effect on GSC numbers (N: CB/SGC and GSC quantification results; n = germarial number). Scale bars, 10 μm. (***P ≤ 0.001; *P ≤ 0.05).
