
Fig. 2. Genetic ablation of local sympathetic innervations promoted the LPS-elicited innate immune response in the lung.
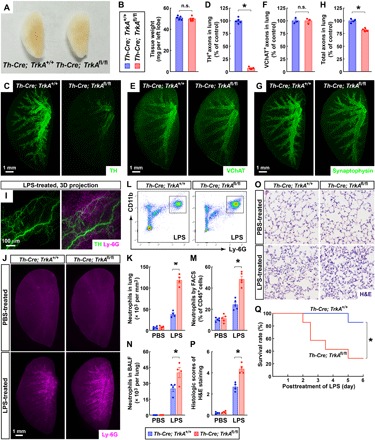
(A and B) Normal development of the lungs of Th-Cre; TrkAfl/fl mice. (A) Gross appearance of the lungs (left lobe) of Th-Cre; TrkA+/+ versus Th-Cre; TrkAfl/fl adult mice. Photo credit: Tingting Liu, Peking University. (B) The tissue weight of the lungs was quantified. n = 5, means ± SEM, n.s., not significant (Student’s t test). (C to H) Genetic ablation of local sympathetic innervations in the lungs of Th-Cre; TrkAfl/fl mice. The lungs (left lobe) of Th-Cre; TrkA+/+ and Th-Cre; TrkAfl/fl mice were processed for the whole-tissue immunolabeling of anti-TH (C and D), anti-VChAT (E and F), or anti-synaptophysin (G and H). (C, E, and G) Representative 3D projection images at ×1.26 magnification of the lightsheet imaging are shown. (D) TH-positive sympathetic axons were quantified. n = 5, means ± SEM, *P < 0.01 (Student’s t test). (F) VChAT-positive parasympathetic axons were quantified. n = 3, means ± SEM, n.s., not significant (Student’s t test). (H) Synaptophysin-positive total axons were quantified. n = 4, means ± SEM, *P < 0.01 (Student’s t test). (I) Spatial engagement of local sympathetic innervations with the LPS-elicited immune response in the lung. The wild-type mice were intranasally treated with LPS. The lung (left lobe) was then processed for the whole-tissue coimmunolabeling of anti-TH (green) and anti–Ly-6G (magenta). Representative 3D projection images of the 600-μm depth of the intact tissue at ×12.6 magnification of the lightsheet imaging are shown. (J to Q) Genetic ablation of local sympathetic innervations in the lung promoted the LPS-elicited immune response. Th-Cre; TrkA+/+ and Th-Cre; TrkAfl/fl mice were intranasally treated with saline control or LPS. (J and K) The lungs (left lobe) were processed for the whole-tissue anti–Ly-6G immunolabeling. (J) Representative 3D projection images at ×1.26 magnification of the lightsheet imaging are shown. (K) The density of Ly-6G+ neutrophils was quantified. n = 4, means ± SEM, *P < 0.01 (ANOVA test). (L and M) CD45+ CD11b+ Ly-6G+ neutrophils in the lungs were examined by the FACS analysis (L) and quantified (M). n = 5, means ± SEM, *P < 0.01 (ANOVA test). (N) CD45+ CD11b+ Ly-6G+ neutrophils in the bronchoalveolar lavage fluid (BALF) were quantified by the FACS analysis. n = 4, means ± SEM, *P < 0.01 (ANOVA test). (O and P) The lung tissues were assessed by H&E (hematoxylin and eosin) staining. (O) Representative images are shown. (P) The histologic scores were determined. n = 4, means ± SEM, *P < 0.01 (ANOVA test). (Q) The survival rate of the mice was followed for 6 days after the LPS treatment. n = 7, *P < 0.05 (log-rank test).