
Fig. 6. β2-Adrenergic receptor signaling suppresses the innate immune responses in the lung.
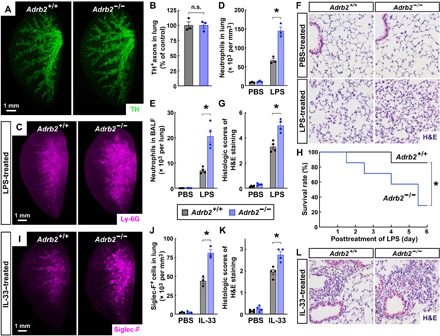
(A and B) Normal development of local sympathetic innervations in the lungs of Adrb2−/− mice. The lungs (left lobe) of Adrb2+/+ and Adrb2−/− mice were processed for the whole-tissue anti-TH immunolabeling. (A) Representative 3D projection images at ×1.26 magnification of the lightsheet imaging are shown. (B) TH-positive sympathetic axons were quantified. n = 3, means ± SEM, *P < 0.01 (Student’s t test). (C to H) Genetic deletion of the β2-adrenergic receptor boosted the LPS-elicited immune response. Adrb2+/+ and Adrb2−/− mice were intranasally treated with saline control or LPS. (C and D) The lungs (left lobe) were processed for the whole-tissue anti–Ly-6G immunolabeling. (C) Representative 3D projection images at ×1.26 magnification of the lightsheet imaging are shown. (D) The density of Ly-6G+ neutrophils was quantified. n = 3, means ± SEM, *P < 0.01 (ANOVA test). (E) CD45+ CD11b+ Ly-6G+ neutrophils in the BALF were quantified by the FACS analysis. n = 4, means ± SEM, *P < 0.01 (ANOVA test). (F and G) The lung tissues were assessed by H&E staining. (F) Representative images are shown. (G) The histologic scores were determined. n = 4, means ± SEM, *P < 0.01 (ANOVA test). (H) The survival rate of the mice was followed for 6 days after the LPS treatment. n = 7, *P < 0.05 (log-rank test). (I to L) Genetic deletion of the β2-adrenergic receptor enhanced the IL-33–elicited immune response in the lung. Adrb2+/+ and Adrb2−/− mice were intranasally treated with saline control or IL-33. (I and J) The lungs (left lobe) were processed for the whole-tissue anti–Siglec-F immunolabeling. (I) Representative 3D projection images at ×1.26 magnification of the lightsheet imaging are shown. (J) The density of Siglec-F+ immune cells was quantified. n = 3, means ± SEM, *P < 0.01 (ANOVA test). (K and L) The lung tissues were assessed by H&E staining. (L) Representative images are shown. (K) The histologic scores were determined. n = 4, means ± SEM, *P < 0.01 (ANOVA test).