
Fig. 3. Patterned alignment of HDF cells on LCE predesigned with a pair of −1 and radial +1 (splay type) defects.
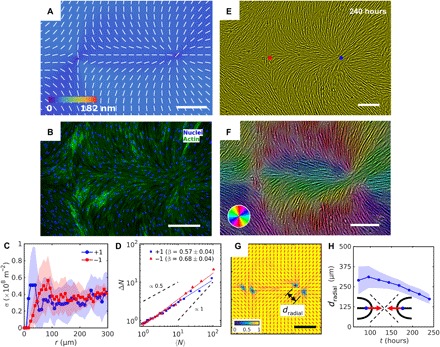
(A) PolScope image of pattern of LCE in contact with the cell growth medium. (B) Fluorescently labeled HDF cells. (C) The surface density of cell nuclei σ as the function of distance from defect cores. (D) Large number density fluctuations ΔN with mean number of nuclei 〈N〉 showing a larger slope near −1 cores as compared to +1. (E) PCM textures of HDF cells on LCE layer at 240 hours after cell seeding. Red and blue dots denote location of −1 and +1 defects in patterned LCE obtained from crossed polarized textures. (F) Color-coded orientational field and (G) of the corresponding scheme of patterned HDF tissue director obtained from local anisotropy of PCM texture in (E). Red bars in (G) denote local orientation of cells’ long axes. (H) Time dependence of separation between two +1/2 defects near the +1 radial core. Scale bars, 300 μm.