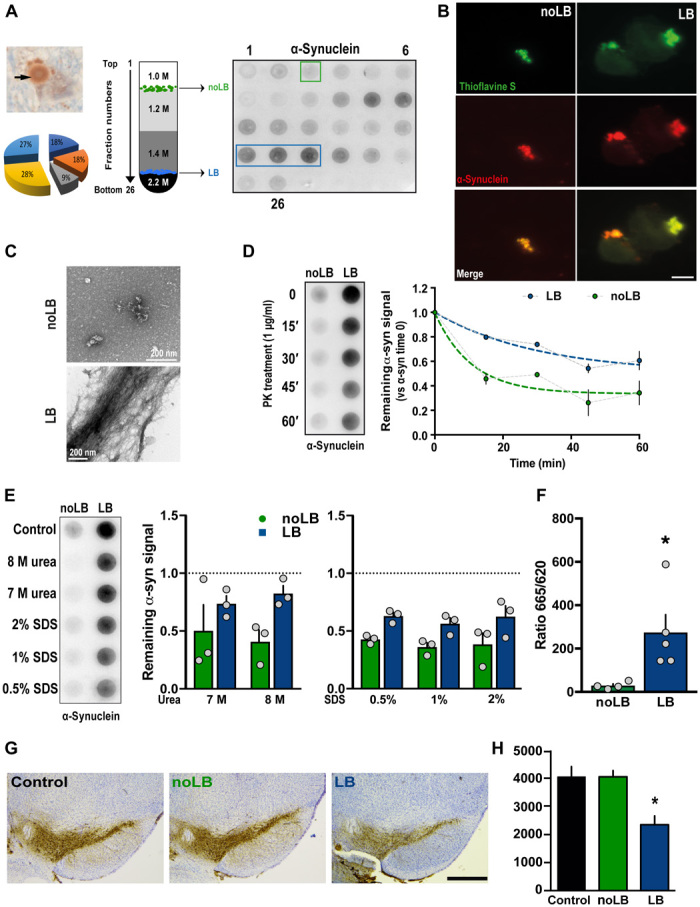
Fig. 1. Purification and characterization of LBs and noLB inocula from PD brains.

(A) Left: Immunohistochemistry image of α-syn–positive LB (arrows) in nigral postmortem brain samples (PD #1; α-syn in brown and neuromelanin in dark brown) before sucrose gradient purification. The pie chart indicates the relative contribution of the five patients to the final pool of LB and noLB inocula. Middle: Schematic representation of the sucrose gradient fractionation procedure used to purify LB/noLB-containing fractions from freshly frozen postmortem nigral brain tissue of five sporadic patients with PD. Right: Filter retardation assay probed with a human α-syn antibody to assess the presence of α-syn aggregates in the different fractions obtained by sucrose gradient fractionation from freshly frozen postmortem nigral brain tissue from sporadic patients with PD (PD #1). Green square indicates noLB-containing fraction, and blue rectangle highlights LB-containing fraction selected to prepare the mixture used for injections. (B) Confocal examination of purified noLB and LB fractions with α-syn immunofluorescence (red) and thioflavin S (green) staining. Both LB and noLB present thioflavin S–positive aggregates but much smaller in noLB fractions. Scale bar, 10 μm. (C) Ultrastructural examination of noLB and LB fractions by electron microscopy showing massive fibrils in LB fractions, while noLB fractions contain, besides soluble α-syn, some punctiform small-size aggregates. (D) noLB and LB fractions derived from PD brains (left) were treated with proteinase K (PK) (1 μg/ml) for 0, 15, 30, 45, and 60 min and analyzed by immunoblotting with syn211 antibody. The median effective concentration (EC50) value was determined as the concentration at which this ratio is decreased by 50%. The corresponding EC50 value for LB (>60 min) was approximately fourfold greater than with noLB (15.23 min). (E) noLB and LB fractions were treated for 6 hours with increasing concentrations of either urea or SDS or buffer as control. Syn211 was used to detect the forms of α-syn. The LB fractions appear to be more resistant to breakdown compared with noLB fractions in both urea (F1,8 = 6.063, P = 0.0392) and SDS treatments (F1,12 = 17.41, P = 0.0013). The dotted lines show levels of control fractions. Comparison was made using two-way analysis of variance (ANOVA). (F) TR-FRET immunoassay analysis of noLB and LB fractions. Fluorescence measurements were taken 20 hours after antibody. Analysis by unpaired Student’s t test (t7 = 2623, P = 0.0343). *P < 0.05. Means ± SEM, n = 4 to 5. (G) Representative pictures of tyrosine hydroxylase (TH)–positive SNpc neurons (brown; Nissl staining in purple) in noninjected and noLB- or LB-injected mice at 4 months after injections. Scale bar, 500 μm. (H) Quantification of TH-positive SNpc neurons by stereology in control and LB- and noLB-injected mice. Control mice, n = 10; LB-injected mice at 4 months, n = 10; noLB-injected mice at 4 months, n = 10. Comparison was made using one-way ANOVA followed by Tukey test for multiple comparisons. *P < 0.05 compared with control and noLB-injected mice at 4 months.
