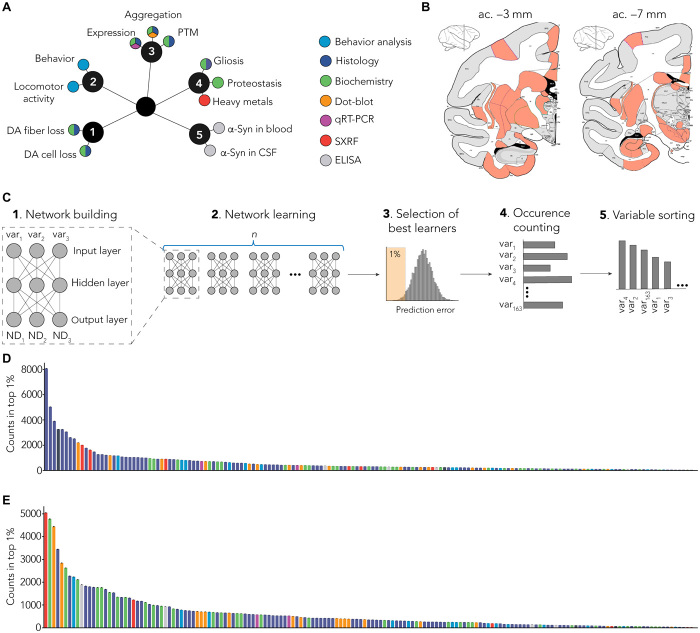
Fig. 3. MLP-based identification of specific signature.
(A) Several end points (n = 180) were measured using multiple methods (colors). End points can be grouped as clusters: (1) dopaminergic degeneration, (2) behavior, (3) α-syn–related pathology, (4) non–α-syn–related pathology, and (5) putative biomarkers. PTM, posttranslational modification; CSF, cerebrospinal fluid; qRT-PCR, quantitative reverse transcription polymerase chain reaction; DA, dopamine. (B) Multiple brain regions (n = 40) were investigated from coronal sections at two levels: anterior commissure (ac.), −3 mm (striatum and entorhinal cortex) and −7 mm (SNpc and hippocampus). SXRF, nano-synchrotron X-Ray fluorescence. (C) Detailed methodology. (1) Representative scheme of one MLP predicting three neurodegeneration-related variables (ND1, ND2, and ND3) with three experimental variables as input (var1, var2, and var3). Of the 180 variables measured in total, 163 were used as inputs for the MLP. (2) One MLP was trained for every unique combination of three variables. (3) Combinations were ranked on the basis their prediction error, and top 1% was selected for further analysis. (4) Combinations were deconvoluted to extract single variables and count occurrence of individual variables. (5) Variables were sorted on the basis of the number of occurrences in the top 1% of the best combination. (D) Raw ranking obtained for LB-injected animals. Color code highlights measurement methods as in (A). (E) Raw ranking obtained for noLB-injected animals. Color code highlights measurement methods as in (A).

