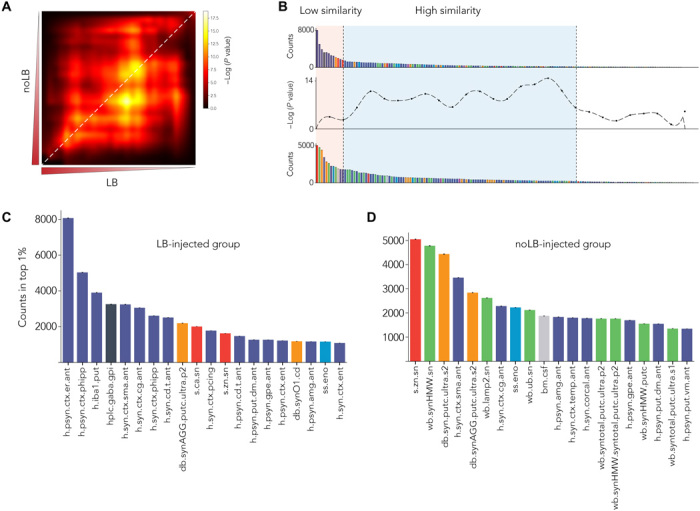
Fig. 4. Direct comparison of MLP-derived signatures shows specific pattern between experiment groups.

(A) RRHO test between variable sorting of LB- and noLB-injected animals. Highly enriched variables are in the lower left corner. Diagonal (highlighted by white dashed line) was extracted to do a bin-to-bin comparison between LB and noLB signatures. (B) Signatures were aligned with RRHO and show low similarity in highly enriched variables (light orange background) and higher similarity for lower rank variables (pale blue background). (C and D) First 20 enriched variables for both LB-injected animals (C) and noLB-injected animals (D). Color code is similar to Fig. 2A. Detailed of variable names can be found in table S1. Bars are means ± 99% confidence interval estimated by bootstrap.
