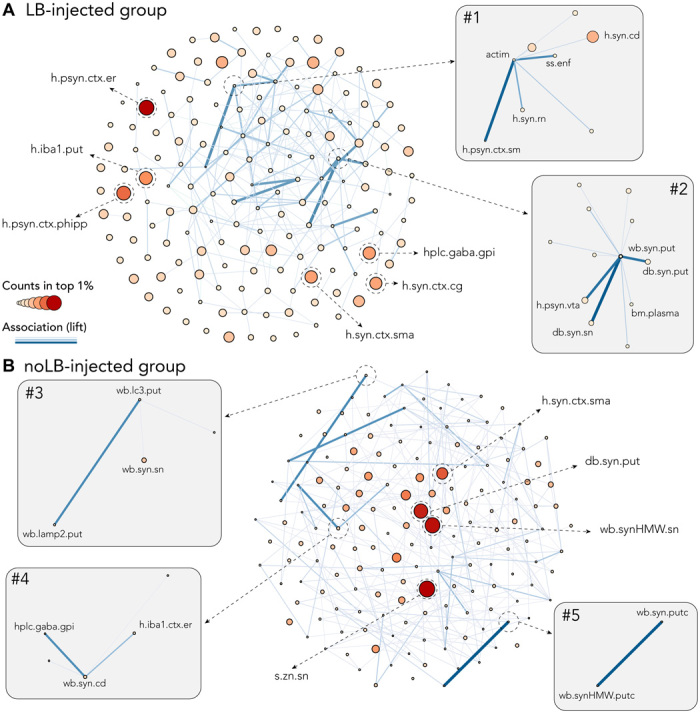
Fig. 6. Association metric shows independence of strong predictors and beneficial association of weaker predictors.

Both network plots were built using number of counts in the top 1% as node size and color and lift (association measure) as edges. To allow better visualization, only 10% of the strongest edges are shown. (A) Network plot for LB-injected animals showing independence of strong predictors: S129 phosphorylated α-syn (psyn) in the entorhinal (h.psyn.ctx.er) and the parahippocampal cortex (h.psyn.ctx.phipp), microglia activation in the putamen (h.iba1.put), α-syn in the cingulate cortex (h.syn.ctx.cg), and the supplementary motor area (h.syn.ctx.sma) and γ-aminobutyric acid (GABA) levels in the internal part of the globus pallidus (hlpc.gaba.gpi). Inset #1 highlights the association between actimetry measure (actim) and a scan-sampling measure of body direction toward a closed environment (ss.enf) with α-syn levels in the caudate nucleus (h.syn.cd), the red nucleus (h.syn.rn), and psyn in the sensorimotor cortex (h.psyn.ctx.sm). Inset #2 highlights the association between pathological α-syn in the putamen (wb.syn.put and db.syn.put) and the SNpc (db.syn.sn) as well as psyn in the ventral tegmental area (h.psyn.vta) and peripheral levels of α-syn in the plasma (bm.plasma). (B) Network plot for noLB-injected animals showing independence of strong predictors: levels of Zn in the SNpc (s.zn.sn), pathological α-syn in the putamen (db.syn.put), α-syn in the supplementary motor area (h.syn.ctx.sma), and aggregated α-syn in the SNpc (wb.synHMW.sn). Inset #3 highlights the association between autophagosomes (wb.lc3.put) and lysosomes (wb.lamp2.put) levels in the putamen and α-syn in the SNpc (wb.syn.sn). Inset #4 highlights the association between GABA levels in the internal part of the globus pallidus (hlpc.gaba.gpi), α-syn in the caudate nucleus (wb.syn.cd), and microglia activation in the entorhinal cortex (h.iba1.ctx.er). Inset #5 highlights the association between soluble (wb.syn.putc) and aggregated (wb.synHMW.putc) levels of α-syn in the putamen.
