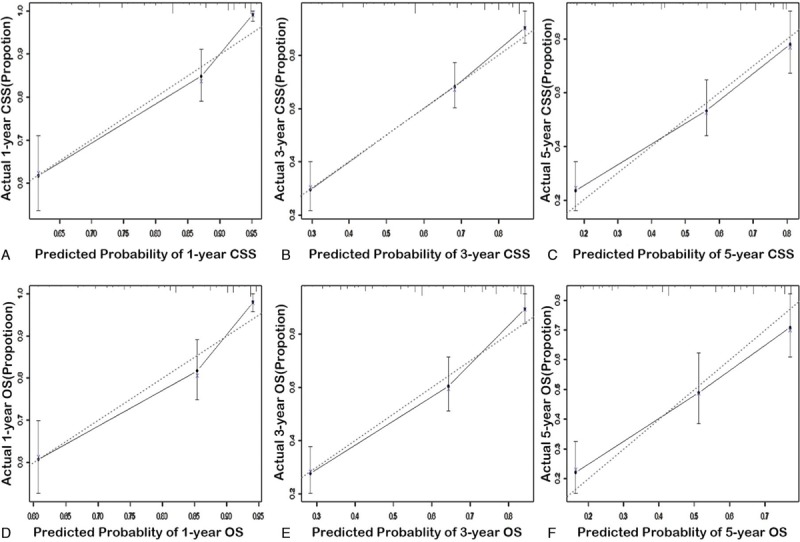
Figure 3.

The calibration curves for prediction of 1-, 3-, and 5-year cancer-specific survival (A–C) and overall survival (D–F) in the training cohort (internal calibration). The dashed lines represent perfect agreement between the predicted probabilities (x-axis) and the actual probabilities which were calculated by Kaplan–Meier analysis (y-axis). A perfectly accurate nomogram prediction model would result in a plot where the actual and predicted probabilities fall along the 45° line.
