Figure 3.

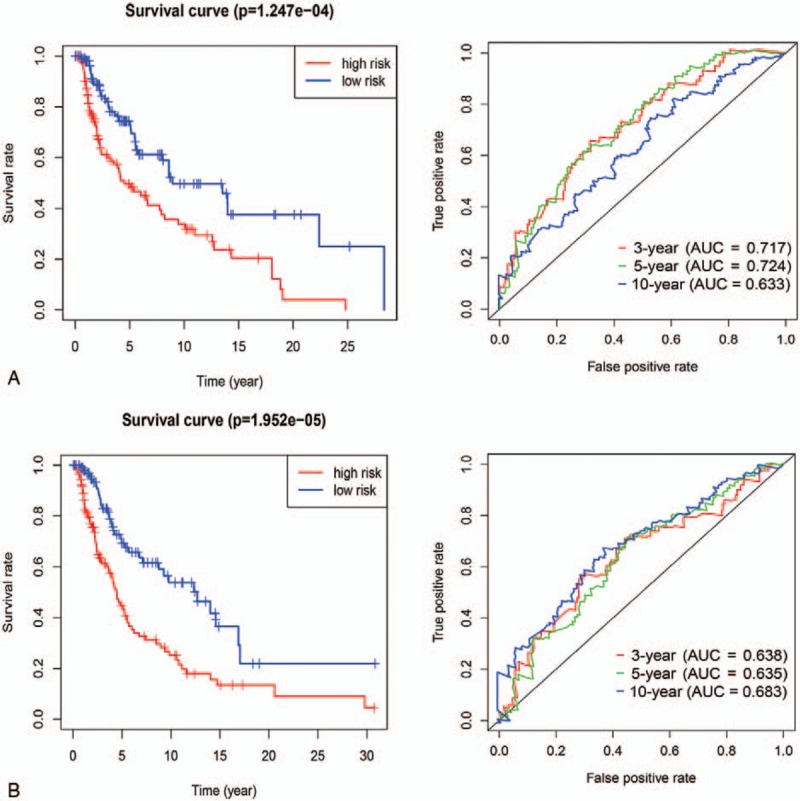
The Kaplan–Meier survival curves and time-dependent ROC curves by the risk score in training set (A) and in the validation set (B).

The Kaplan–Meier survival curves and time-dependent ROC curves by the risk score in training set (A) and in the validation set (B).