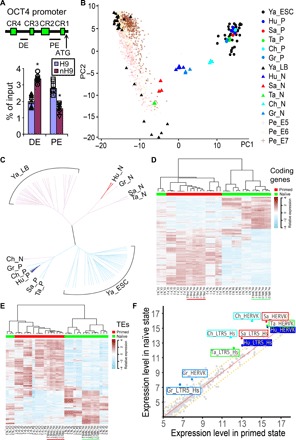
Fig. 3. Transcriptomic profiles of naïve hPSCs.

(A) H3K27Ac chromatin immunoprecipitation assays showing the utilization of OCT4 distal enhancer (DE) and proximal enhancer (PE) in primed H9 and nH9. P < 0.05, n = 6 versus H9. (B and C) PCA (B) and clustering analysis (C) of RNA-seq data from naïve (Hu_N; blue triangles) and primed (Hu_P; blue dots) H9 and RUES2 against data on single cells from human late blastocysts (Ya_LB; black triangles) (27); human E5 to E7 embryos (Pe_E5, Pe_E6, and Pe_E7; brown pluses) (28); hESCs (Ya_ESC; black dots) (27); or bulk RNA-seq data from naïve hPSCs maintained in chemical inhibitors [Sa_N (red triangles) (29), Ta_N (green triangles) (8), Ch_N (cyan triangles) (7), and Gr_N (light blue triangles) (30)] and their parental primed hPSCs [Sa_P (red dots) (29), Ta_P (green dots) (8), Ch_P (cyan dots) (7), and Gr_P (light blue dots) (30)]. Primed hPSCs (represented by dots) are named by first two letters of the first author’s family name, followed by _P. Naive hPSCs (represented by triangles) are named accordingly with _N. Matching color of dot and triangle indicates the same genome. (D) Coding genes that were differentially expressed between our naïve (underlined green) and primed (underlined red) H9 and RUES2 as compared with expression patterns in other naïve and primed hPSCs. (E) Transposable elements differentially expressed between our naïve (underlined green) and primed (underlined red) H9 and RUES2 as compared with expression patterns in other naïve and primed hPSCs. (F) Increased expression of TEs such as HERVK and LTR5_Hs in our naïve cells (Hu_*; blue) and other naïve cells as compared with their corresponding primed hPSCs.
