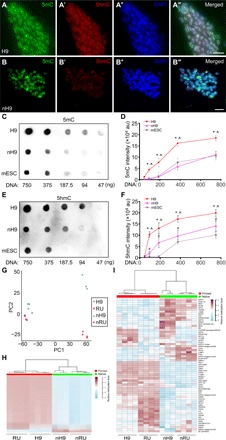
Fig. 5. Decreased DNA methylation in naïve hPSCs.

(A to B‴) Costaining for 5mC (A and B), 5hmC (A′ and B′), and DAPI (A″ and B″) in primed H9 (A to A‴) and nH9 (B to B‴). Scale bars, 10 μm. (C to F) Dot blots (C and E) and quantification (D and F) of 5mC (C and D) and 5hmC (E and F) levels in genomic DNA isolated from primed and naïve H9, and AB2.2 mESC. *H9 versus mESC; ^H9 versus nH9; #nH9 versus mESC, all at P < 0.05, n = 3, unpaired, two-tailed t test. au, arbitrary units. (G) PCA of genome-wide DNA methylation in primed and naïve H9 and RUES2 using β values of all probes in Infinium MethylationEPIC BeadChip. (H) Comparison of DNA methylation levels in the 128,383 tiling regions that were differentially methylated between primed and naïve H9 and RUES2. (I) Comparison of DNA methylation levels in imprinted regions (38) between primed and naïve H9 and RUES2. H9, primed H9; nH9, naïve H9; RU, RUES2; nRU, naïve RUES2.
