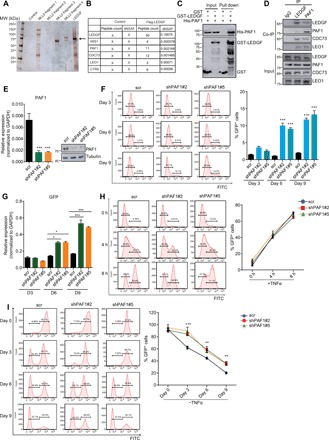
Fig. 2. PAF1 complex associates with LEDGF/p75 and is required for both the establishment and maintenance of HIV latency.

(A) Visualization of factors associating with LEDGF/p75 in silver stain gel. Arrow denotes the Flag-tagged LEDGF/p75 in the silver stain gel. MW, molecular weight. (B) Identification of factors associating with LEDGF/p75 by MudPIT analysis. Normalized spectral abundance factors (NSAF) are shown for the candidate factors. (C) Direct interaction between PAF1 and LEDGF/p75 demonstrated by glutathione S-transferase (GST) pull-down assay. Both input and pull-down samples were subjected to immunoblotting with indicated antibodies. (D) Association between the endogenous LEDGF/p75 and PAF1 complex in E4 cells revealed by reciprocal coimmunoprecipitation (Co-IP) assay. IgG, immunoglobulin G. (E) PAF1 transcript and protein level in E4 cells were assessed by RT-qPCR and Western blot 72 hours after PAF1 depletion with two independent shRNAs. PAF1 mRNA level was normalized to GAPDH and represented as means + SD (n = 3). (F) Effect of PAF1 knockdown on HIV latency by flow cytometric analysis. A representative flow histogram and quantification of GFP+ cells (means + SD; n = 3) were shown. (G) GFP transcript level in E4 cells depleted for PAF1 for different number of days was determined by RT-qPCR and shown as means + SD (n = 3). (H) Representative flow histograms and quantification of GFP+ cells after distinct hours of TNFα stimulation in E4 cells depleted for PAF1 are shown as means + SD (n = 3). (I) Control and PAF1 knockdown 2D10 cells were fully activated by overnight stimulation with TNFα, and percentage of GFP+ cells was monitored by flow cytometry at indicated time points after TNFα removal. Quantitation is shown as means + SD (n = 3). *P < 0.05, **P < 0.01, and ***P < 0.001
