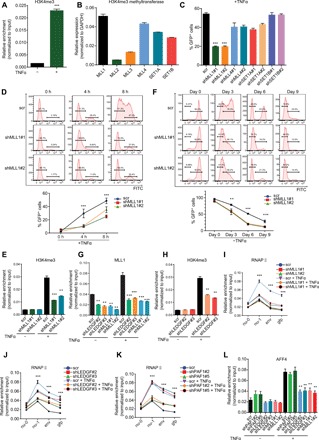
Fig. 4. LEDGF/p75 recruits MLL1 complex to boost HIV transcription during proviral reactivation.

(A) H3K4me3 level at the LTR was normalized to input and shown as means + SD (n = 3). (B) Expression of H3K4 methyltransferases in E4 cells was determined by RT-qPCR and shown as means + SD (n = 3). (C) Flow cytometry to examine viral transcription in E4 cells depleted for indicated H3K4 methyltransferases and quantitation is presented as means + SD (n = 2). (D) Representative flow histograms of proviral reactivation in control- and MLL1- depleted E4 cells stimulated with TFNα for indicated times. Quantitations are shown as means ± SD (n = 2). (E) H3K4me3 level at the LTR in control and MLL1-depleted E4 cells stimulated with TNFα for 4 hours is shown as means + SD (n = 3). (F) Representative flow histograms for the kinetics of latency reversion and their quantitation (means ± SD; n = 3) in control- and MLL1-depleted E4 cells at different time points after TNFα removal are shown. (G) MLL1 occupancy at the LTR in E4 cells depleted for LEDGF/p75 or MLL1 is shown as means + SD (n = 3). (H) H3K4me3 occupancy at the LTR in control- and LEDGF/p75-depleted E4 cells was shown as means + SD (n = 3). (I and J) E4 cells were transduced with shRNAs against MLL1 (I) or LEDGF/p75 (J) and treated with or without TNFα for 4 hours. Pol II distribution over the HIV genome was measured by ChIP-qPCR with the indicated primers and shown as means ± SD (n = 3). (K) Pol II distribution over the proviral genome in control- and PAF1-depelted E4 cells with or without 4 hours of TNFα treatment was shown as means ± SD (n = 3). (L) AFF4 (AF4/FMR2 family member 4) binding at the LTR in E4 cells depleted for the indicated protein and treated with or without TNFα for 4 hours was shown as means ± SD (n = 3). **P < 0.01 and ***P < 0.001.
