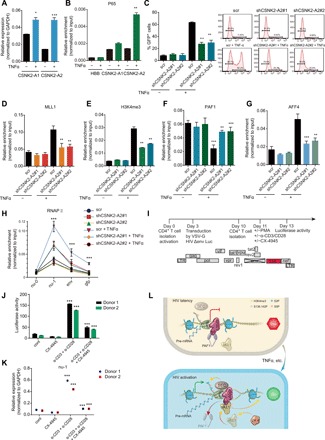
Fig. 6. CSNK2-A2 is crucial for productive proviral transcription during latency reversal.

(A) CSNK2-A2 expression (means + SD; n = 3) in E4 cells stimulated with or without TNFα for 4 hours. (B) p65 occupancy at promoters of the CSNK2-A1, CSNK2-A1, and the negative control HBB gene in E4 cells treated with or without TNFα for 8 hours was normalized to input and presented as means + SD (n = 3). (C) The percentage of GFP+ cells in E4 cells depleted for CSNK2-A2 and treated with TNFα for 8 hours was determined by flow cytometry and shown as means + SD (n = 2; left). Representative flow histograms are shown on the right. (D and E) MLL1 (D) and H3K4me3 (E) level at LTR in E4 cells depleted for CSNK2-A2 and treated with TNFα for 8 hours was normalized to input and shown as means + SD (n = 3). (F and G) PAF1 (F) and AFF4 (G) level at LTR in E4 cells depleted for CSNK2-A2 and treated with TNFα for 8 hours was normalized to input and shown as means + SD (n = 3). (H) Pol II distribution across the HIV genome in E4 cells depleted for CSNK2-A2 and treated with TNFα for 8 hours was normalized to input and shown as means + SD (n = 3). (I) Schematic diagram of the NL4.3-deltaEnv-Luc-Nef construct and the experimental outline to analyze HIV gene expression and reactivation in primary CD4+ T cells upon CSNK2-A2 inhibition. (J and K) Primary CD4+ T cells from two donors were latently infected with VSV-G pseudotyped HIV virus and stimulated with or without α-CD3/CD28 antibodies in the presence or absence CX-4945. Luciferase activities (J) and HIV transcript level (K) (means + SD; n = 3) were shown in the indicated treatment conditions. (L) Schematic diagram of the molecular mechanisms underlying the opposing function of LEDGF/p75 in viral transcription during latency and proviral reactivation after HIV integration. *P < 0.05, **P < 0.01, and ***P < 0.001.
