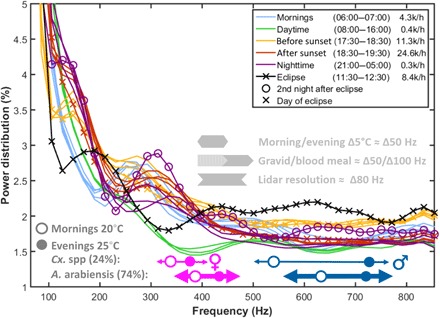
Fig. 3. Average modulation power spectra of the aerofauna during different times of the day.

While the power spectra differ with the time of day, distributions for the same time intervals are consistent between consecutive days (same color graphs). During the eclipse on 1 September, the high-frequency content displays maximal power in the range associated with mosquitoes. In the evening, following the eclipse, reduced activity is displayed around 300 Hz before and after sunset. This is later compensated for during the night between 2 and 3 September. The absolute number of observations is stated in the legend in thousands per hour, and we note that the activity during the eclipse reaches a third of that of a normal evening rush hour. Approximate frequency ranges of Anopheles and Culex wingbeats are indicated underneath the power spectrum curves for both sexes. The gray arrows provide rough indications of possible frequency shifts from temperature and mosquito biomass payload. (For methodological and interpretational details, see the Supplementary Materials.) In addition, the lidar full width at half maximum (FWHM) resolution for a 23-ms time window is indicated.
