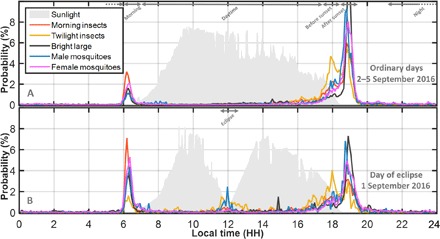
Fig. 5. Time-dependent probability of observation of various insect groups (probability of observing each group during one diurnal cycle is set to 100%, the absolute and relative abundances are given in the previous figure).

Sunlight level measurements are indicated in gray in the background (the fluctuations are due to patchy clouds). (A) Normal days (average of 2 to 5 September 2016). (B) The day of the eclipse (1 September 2016). The intervals from Fig. 3 are indicated at the top of the figures. The insect grouping interpretations are based on selected classifications in Fig. 4 and denominated with identical labels. Uncertain groups are not included.
