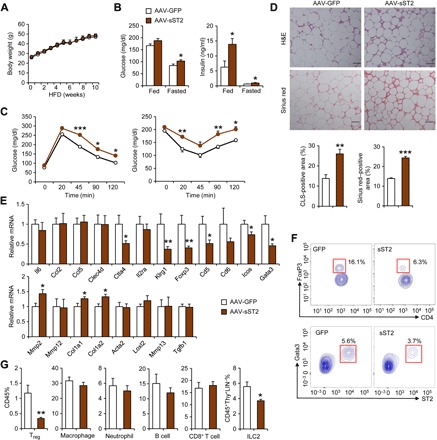
Fig. 2. Overexpression of sST2 exacerbates HFD-induced insulin resistance.

(A) Body weight of mice transduced with AAV-GFP (open, n = 5) and AAV-sST2 (filled, n = 6) fed HFD for 10 weeks. Data represent means ± SEM, two-way ANOVA with multiple comparisons. (B) Blood glucose and plasma insulin concentrations. Data represent means ± SEM. *P < 0.05, GFP versus sST2, two-tailed unpaired Student’s t test. (C) GTT (left) and ITT (right) in mice transduced with AAV-GFP (open, n = 6) or AAV-sST2 (filled, n = 7) after 9 and 11 weeks of HFD feeding, respectively. Data represent means ± SEM. *P < 0.05, **P < 0.01, ***P < 0.001, GFP versus sST2, two-way ANOVA with multiple comparisons. Data in (A) to (C) are representative of three independent experiments. (D) Hematoxylin and eosin (H&E) and Sirius red staining of eWAT sections (top) and quantitation of CLS- and fibrosis-positive area (bottom). (E) qPCR analysis of eWAT gene expression. (F) Representative gating for resident Tregs and ILC2s in eWAT from transduced mice. (G) Percentage of immune cells in CD45+ SVF cells. Data in (E) and (G) represent means ± SEM. *P < 0.05, **P < 0.01, GFP versus sST2, two-tailed unpaired Student’s t test. Data in (D) to (G) are representative of three independent experiments. Scale bar = 100 μm.
