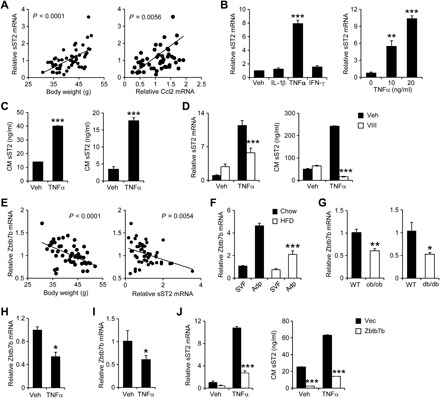
Fig. 3. Adipocyte sST2 expression and secretion are stimulated by TNFα, which is antagonized by Zbtb7b.

(A) Correlation between eWAT sST2 gene expression and body weight (left) and Ccl2 expression (right). (B) qPCR analysis of sST2 mRNA expression in differentiated C3H10T1/2 adipocytes treated with vehicle (Veh), IL-1β (10 ng/ml), TNFα (10 ng/ml), or IFN-γ (10 ng/ml) for 24 hours (left) or indicated doses of TNFα (right). Data represent means ± SD (n = 3). **P < 0.01, ***P < 0.001, versus Veh, one-way ANOVA. (C) The concentrations of sST2 in CM from C3H10T1/2 adipocytes (left) or eWAT explant culture (right) treated with Veh or TNFα (10 ng/ml) for 24 hours. Data represent means ± SD (n = 3). ***P < 0.001, Veh versus TNFα, two-tailed unpaired Student’s t test. (D) sST2 mRNA expression (left) and concentrations (right) in adipocytes treated with TNFα (10 ng/ml) with or without NF-κB inhibitor VIII (VIII; 4 μM) for 24 hours. Data represent means ± SD (n = 3). ***P < 0.001, Veh versus VIII, two-way ANOVA. Data in (B) to (D) are representative of three independent experiments. (E) Correlation between eWAT mRNA expression of Zbtb7b and bodyweight (left) and sST2 (right) in HFD-fed mice. (F) qPCR analysis of Zbtb7b expression in SVF and adipocytes isolated from chow-fed (filled, n = 3) or HFD-fed (open, n = 3) mouse eWAT. Data represent means ± SEM. ***P < 0.001, SVF versus Adp, two-way ANOVA. (G) qPCR analysis of Zbtb7b expression in eWAT from WT (filled, n = 5) and ob/ob (open, n = 3) or WT (filled, n = 4) and db/db (open, n = 4) mice. Data represent means ± SEM. *P < 0.05, **P < 0.01, lean versus obese, two-tailed unpaired Student’s t test. (H and I) qPCR analysis of Zbtb7b expression in differentiated C3H10T1/2 adipocytes (H) and explant fat culture (I) treated with 10 ng/ml TNFα for 24 hours. Data in (H) and (I) represent means ± SEM. *P < 0.05, Veh versus TNFα, two-tailed unpaired Student’s t test. (J) sST2 mRNA expression (left) and concentrations in CM (right) from C3H10T1/2 adipocytes expressing vector (Vec) or Zbtb7b following treatment with TNFα (10 ng/ml) for 24 hours. Data represent means ± SD (n = 3). ***P < 0.001, Vec versus Zbtb7b, two-way ANOVA. Data in (F) to (J) are representative of three independent experiments.
