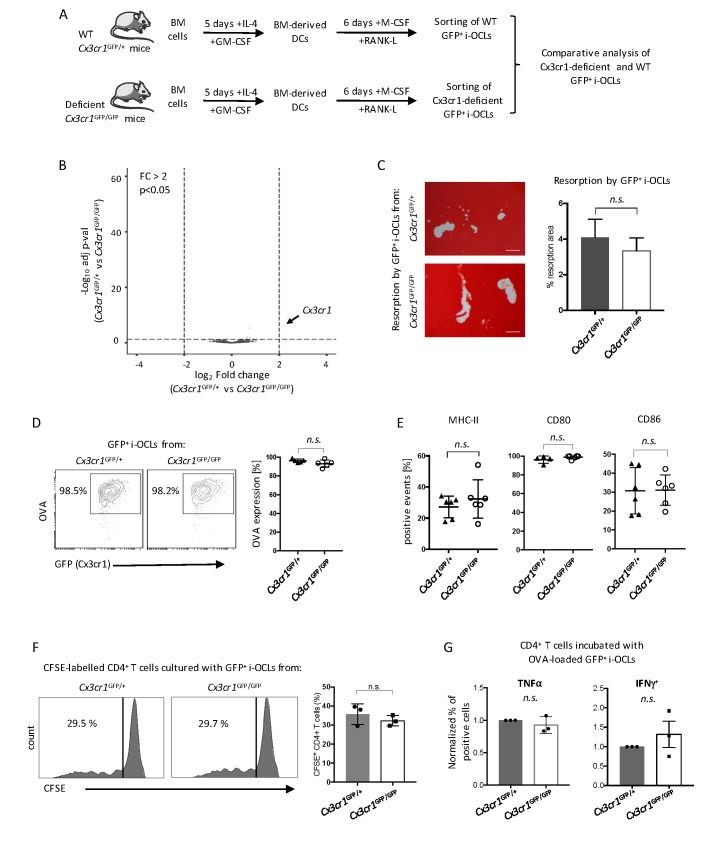
Figure 2. Cx3cr1 deficiency does not affect resorption and immune function in Cx3cr1+ i-OCLs.
(A) Schematic representation of the differentiation of i-OCLs from BM-derived DCs of WT Cx3cr1GFP/+ and Cx3cr-deficient Cx3cr1GFP/GFP mice. (B) RNA-seq analysis on sorted GFP+ i-OCLs (representing Cx3cr1+ i-OCLs) differentiated from BM-derived DCs of WT Cx3cr1GFP/+ and Cx3cr-1deficient Cx3cr1GFP/GFP mice (gated as in Figure 2—figure supplement 1). Volcano-plot indicates –Log10 adjusted p value versus log2 fold-change comparing gene expression in i-OCL subsets. (C) Matrix dissolution activity of sorted GFP+ i-OCLs from WT Cx3cr1GFP/+ and Cx3cr1-deficient Cx3cr1GFP/GFP mice seeded at the same cell density on a calcified matrix was evidence by red alizarin staining of the mineralized matrix. Unstained areas correspond to the resorbed areas. Left panel: representative images of resorbed area. Scale bar = 100 µm. Right panel: quantification of resorbed areas presented as mean ± SD percentage of three independent biological replicates each in triplicates. (D) FACS analysis of fluorescent-OVA uptake among GFP+ i-OCLs from Cx3cr1GFP/+ and Cx3cr1GFP/GFP mice. Left panel: representative density plots and right panel: percentage of OVA+ cells from five independent experiments. (E) FACS analysis of GFP+ i-OCLs from Cx3cr1GFP/+ and Cx3cr1GFP/GFP mice in at least four independent experiments. (F) T cell proliferation assay on CD4+ T cells labelled with CFSE and cultured in the presence of OVA-challenged GFP+ i-OCLs differentiated from Cx3cr1GFP/+ and Cx3cr1GFP/GFP mice and analyzed by FACS after 4 days of coculture. (G) CD4+ T cells activated by OVA-challenged GFP+ i-OCLs from Cx3cr1GFP/+ and Cx3cr1GFP/GFP mice were analyzed for their expression of TNFα and IFNγ by FACS after intracytoplasmic staining of these cytokines. n.s., no significant difference.


