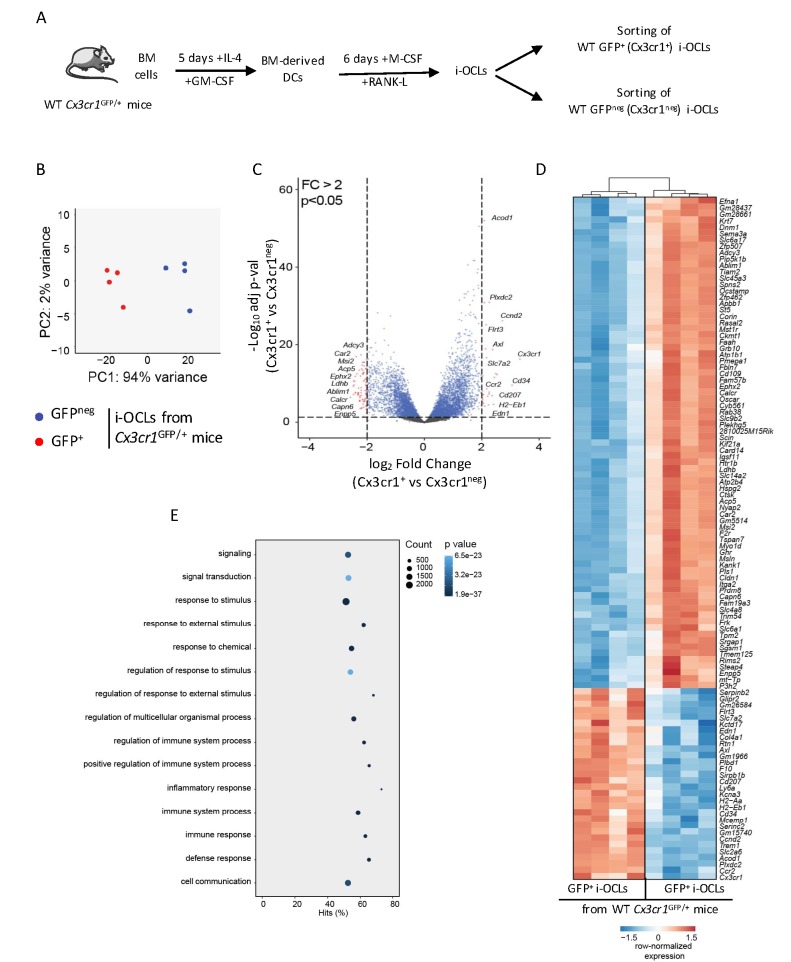
Figure 3. Transcriptomic profiling of Cx3cr1+ and Cx3cr1neg i-OCLs reveals two distinct populations of i-OCLs.
(A) Schematic representation of the differentiation of GFP+ (Cx3cr1+) and GFPneg (Cx3cr1neg) i-OCLs from BM-derived DCs of WT Cx3cr1GFP/+ mice and their sorting (gated as in Figure 2—figure supplement 1). (B) Principal component analysis of Cx3cr1+ and Cx3cr1neg i-OCLs clusters samples in two groups (red: GFP+ (Cx3cr1+) OCLs and blue GFPneg (Cx3cr1neg) OCLs, both from Cx3cr1GFP/+ mice). Data shows the two first components on the top 500 most differentially expressed genes after batch correction. Each dot represents the expression profile of one sample. (C) Volcano-plot showing representative differentially expressed genes for Cx3cr1+ and Cx3cr1neg i-OCLs. Cut-off values were defined by a fold change (FC) >2 and an adjusted p-value<0.05. (D) Heatmap visualization of the top 107 genes significantly differentially expressed between GFP+ (Cx3cr1+) and GFPneg (Cx3cr1neg) i-OCLs from Cx3cr1GFP/+ mice (adjusted p-value<0.05, FC ≥2). (E) Graphical representation of gene ontology analysis associated with differentially expressed genes between Cx3cr1+ and Cx3cr1neg i-OCLs.


