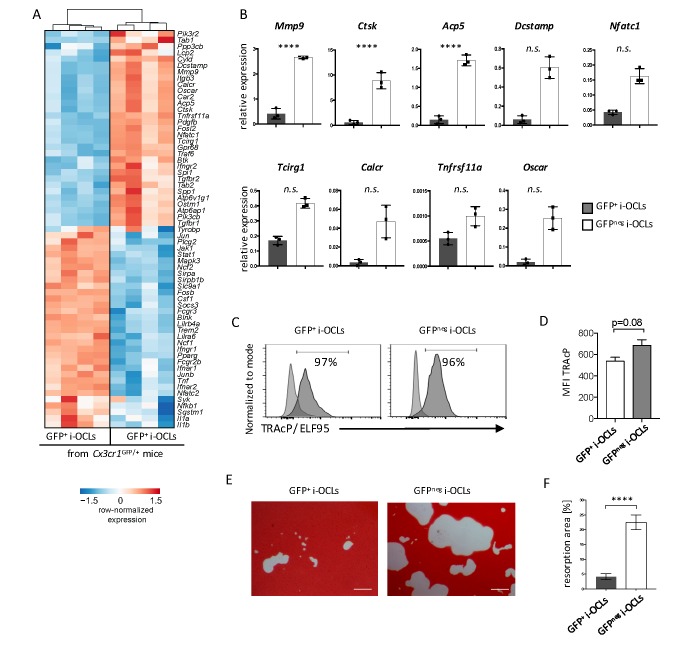
Figure 4. Cx3cr1neg and Cx3cr1+ i-OCLs differ in their resorbing activity.
(A) Heatmap visualization of the z-scored expression for selected genes involved in bone resorption, osteoclast fusion and differentiation that are differentially expressed between GFP+ (Cx3cr1+) and GFPneg (Cx3cr1neg) i-OCLs both differentiated from WT Cx3cr1GFP/+ mice (adjusted p-value<0.05, FC ≥2). (B) RT-qPCR analysis on GFP+ (Cx3cr1+) and GFPneg (Cx3cr1neg) i-OCLs. Results are represented as the mean with 95% confidence interval of 3 independent biological replicates in triplicates. (C) Flow cytometry analysis of TRAcP expression using ELF95 substrate in the 2 i-OCLs subsets. Percentage of positive cells (dark curve) compared to the negative control (light curve) is indicated. (D) Quantification of the mean fluorescence intensity (MFI) of TRAcP in GFP+ (Cx3cr1+) and GFPneg (Cx3cr1neg) i-OCLs (n = 3). (E) Representative images of matrix dissolution activity of sorted GFP+ (Cx3cr1+) and GFPneg (Cx3cr1neg) i-OCLs seeded at the same cell density. Red alizarin staining of the mineralized matrix revealed the resorbed areas as unstained. Scale bar = 100 µm. (F) Quantification of resorbed areas from three independent experiments in triplicates are indicated as percentage. ****p<0.0001; n.s., no significant difference.


